Overview
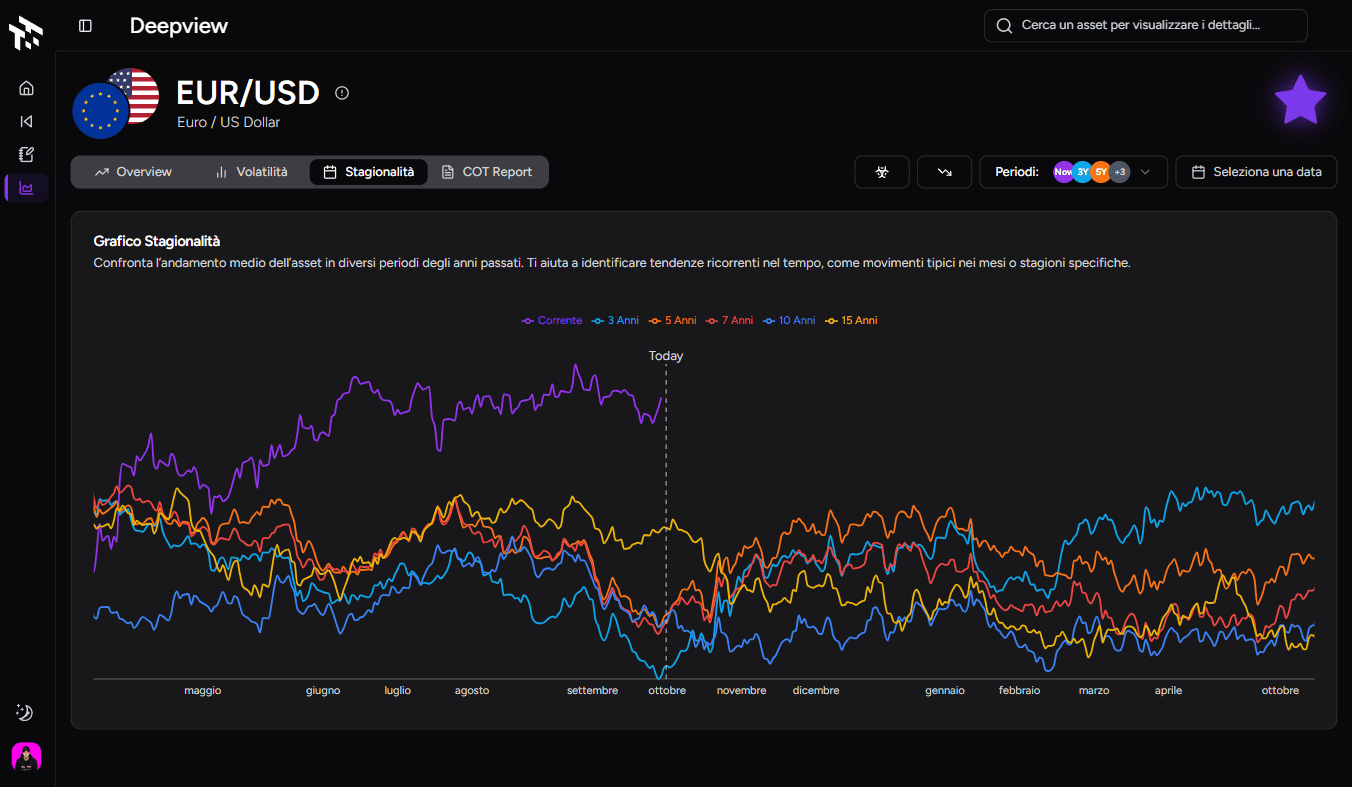
See how an asset has moved over time, compare past periods and review sentiment in the same view.
Market seasonality, volatility and performance in one dashboard.
COT and Sentiment for supported assets.
Chosen by leading trading communities


Bring seasonality, volatility, positioning and sentiment into the same analysis.
See how an asset has moved over time, compare past periods and review sentiment in the same view.
See how volatility changes through the day and identify the hours when the market tends to move most.
Compare past years and look for recurring behaviour across the period you are studying.
See how dealers, funds and institutions are positioned and compare long and short exposure over time.
View retail trader positioning.





Forex, indices, crypto, commodities, stocks and ETFs.
Choose a period and compare the asset’s data over time.
View monthly and yearly asset performance
Discover average hourly and daily volatility
Display the chart using the historical range you choose
Simulate the same trade every year and analyse the results.
Save favourite assets and find them faster
Review long and short positioning for every COT category
Find your market and check COT and Sentiment availability.
98 assets
TotalTrade brings together the tools you use every day to make trading clearer and measurable.
Start for free