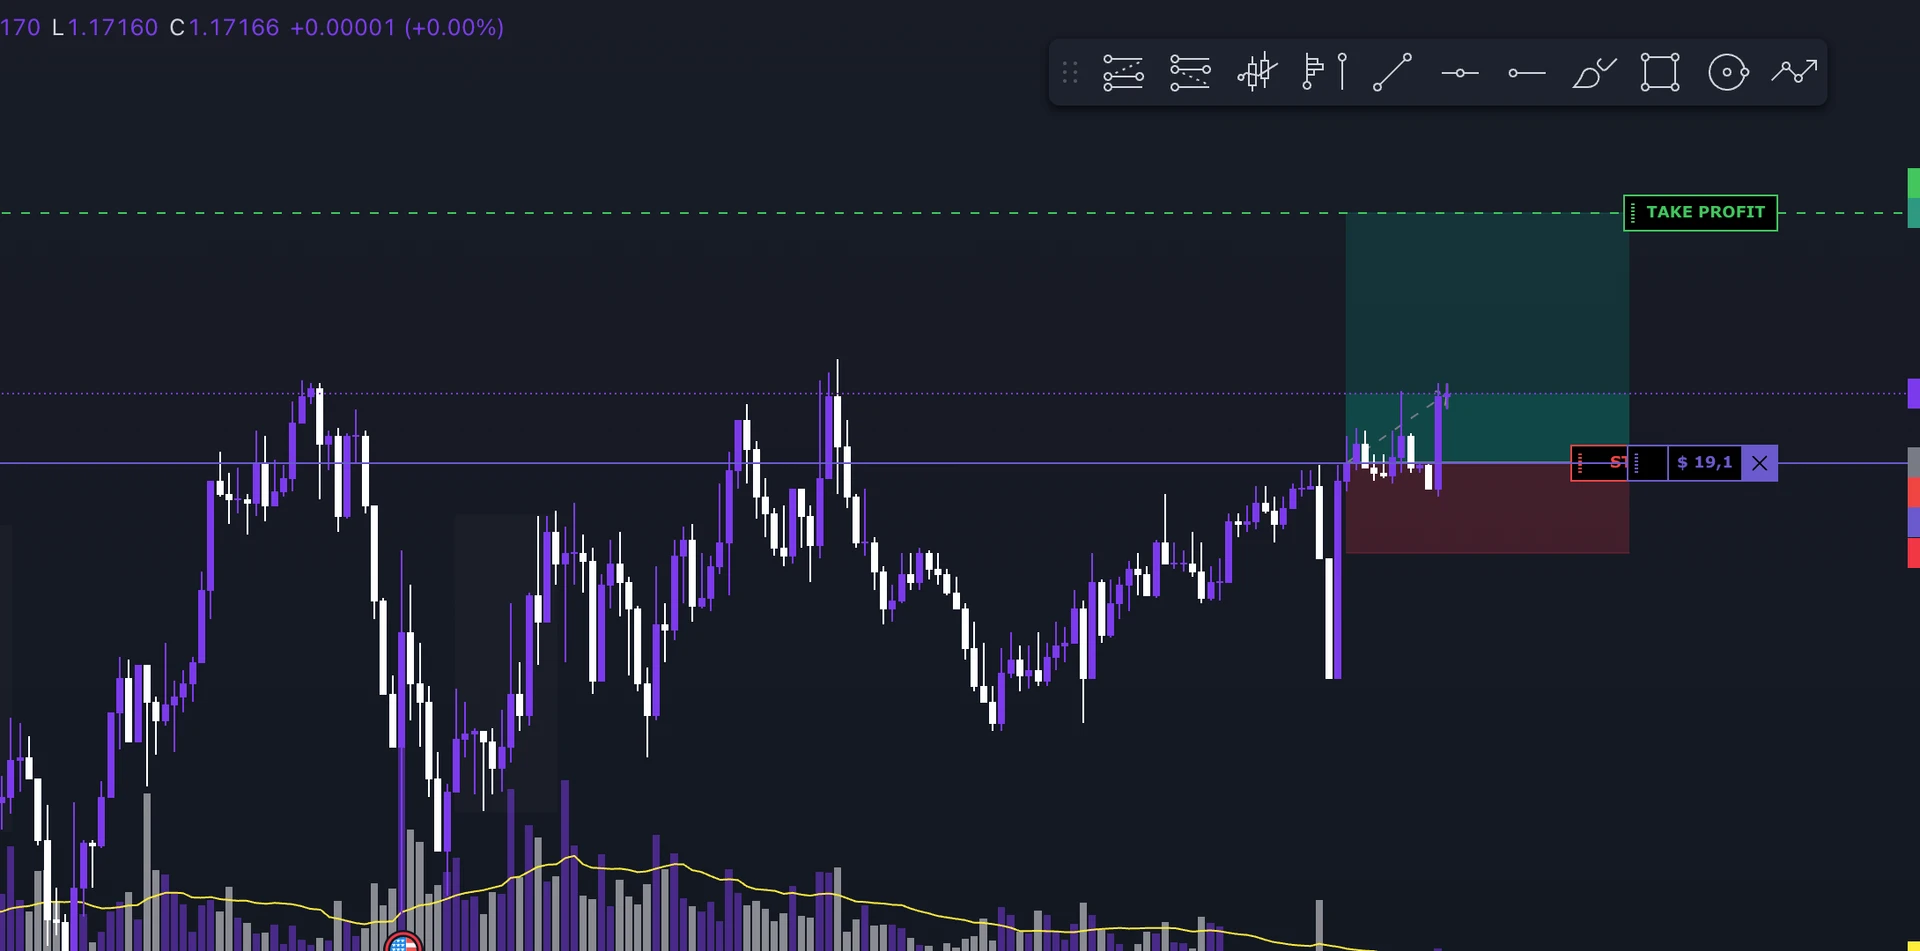
Moving your stop to break even means pulling it to your entry price once the trade is in profit. The benefit is obvious: some trades that would have hit a full stop close flat instead. The cost is harder to see: other trades get closed at entry, and then price goes on to hit your target without you. Whether break-even helps you depends on which effect weighs more on your trades, and the only way to know is to compare results.
Break-even on price isn't break-even on the account
On a long, the stop moves up to entry; on a short, it moves down. If it fills exactly there, the price move on the open size is zero. Your net result can still be negative:
- commissions and financing costs still apply;
- the spread is already built into buy and sell prices;
- slippage can fill the stop at a worse price.
That's why some traders place the stop a few ticks beyond entry to cover costs. It's a different rule from a pure break-even and should be tested separately.
If you've already taken a partial, the trade can end in profit even when the rest is stopped at entry. Closing 50% at +1R and 50% at zero gives +0.5R gross on the whole trade.
Two ways to decide when to move it
An R threshold. You move the stop after a set gain, for example at +1R. R is your initial risk: if the loss at your stop would be $100, +1R means $100 of open profit on the original position. It's easy to apply and to compare across many trades.
Price structure. You move the stop once the market confirms the move, for example after a new higher low on a long. It accounts for levels, volatility and how far price has already run, but it's harder to standardize.
Either way, check where the stop actually ends up on the chart. Your entry price is an accounting reference, not a level the market respects. If the stop sits inside normal noise, you can be taken out while the setup is still valid.
Losses avoided vs. targets missed: an example in R
Compare the same 10 trades with and without break-even, before costs:
| Group | Without break-even | With break-even | Difference |
|---|---|---|---|
| 2 trades that returned to the stop | −1R each = −2R | 0R | +2R |
| 3 trades that pulled back, then hit target | +2R each = +6R | 0R | −6R |
| 5 unchanged trades | same | same | 0 |
| Total | −4R |
In this sample, missed targets outweigh the losses avoided. With other trades the result can flip. That's the point of the comparison: measure both effects rather than decide based on the last trade that made you regret moving your stop.
Evaluating it in discretionary backtesting
If you move your stop based on the chart, replay lets you reproduce that decision. A note like "impulse completed, new higher low formed, protecting the trade" is far more useful than a generic "exit at BE".
During review, look at both the trades saved from a loss and the ones cut short before target. If you re-entered after a break-even exit, the costs and result of that new entry are part of the same management approach.
Watch simulation quality in fast moves: if a single candle touches both the level that triggers break-even and your entry price, its high and low can't tell you which came first. Data resolution and how the simulator handles it affect the result.
Comparing it with the Backtest Simulator
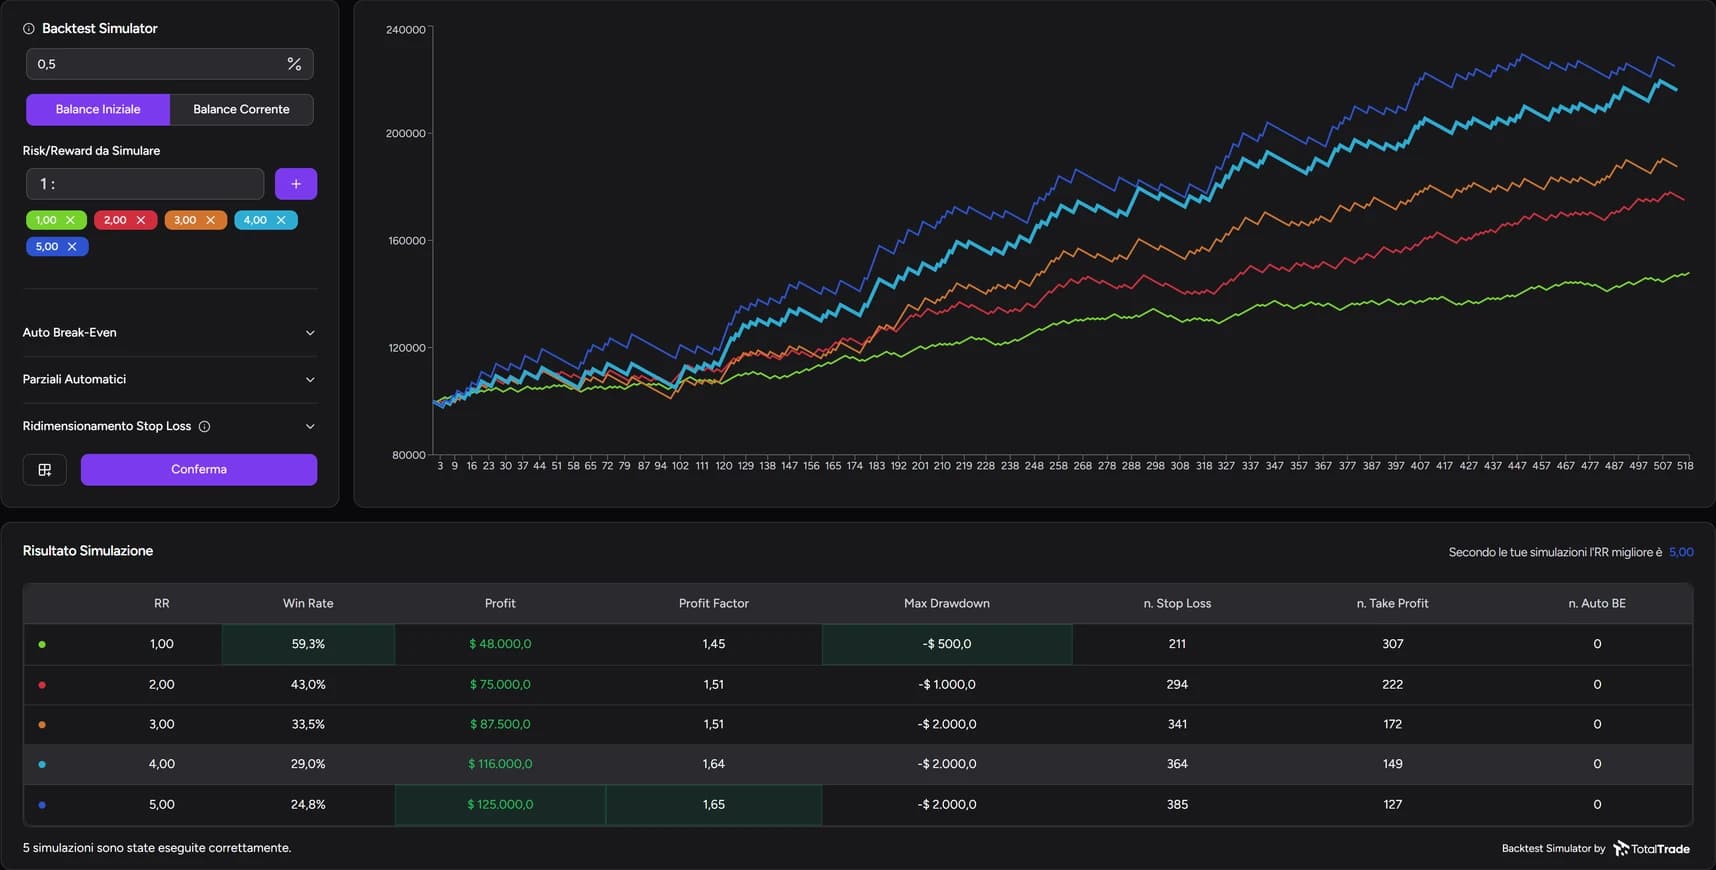
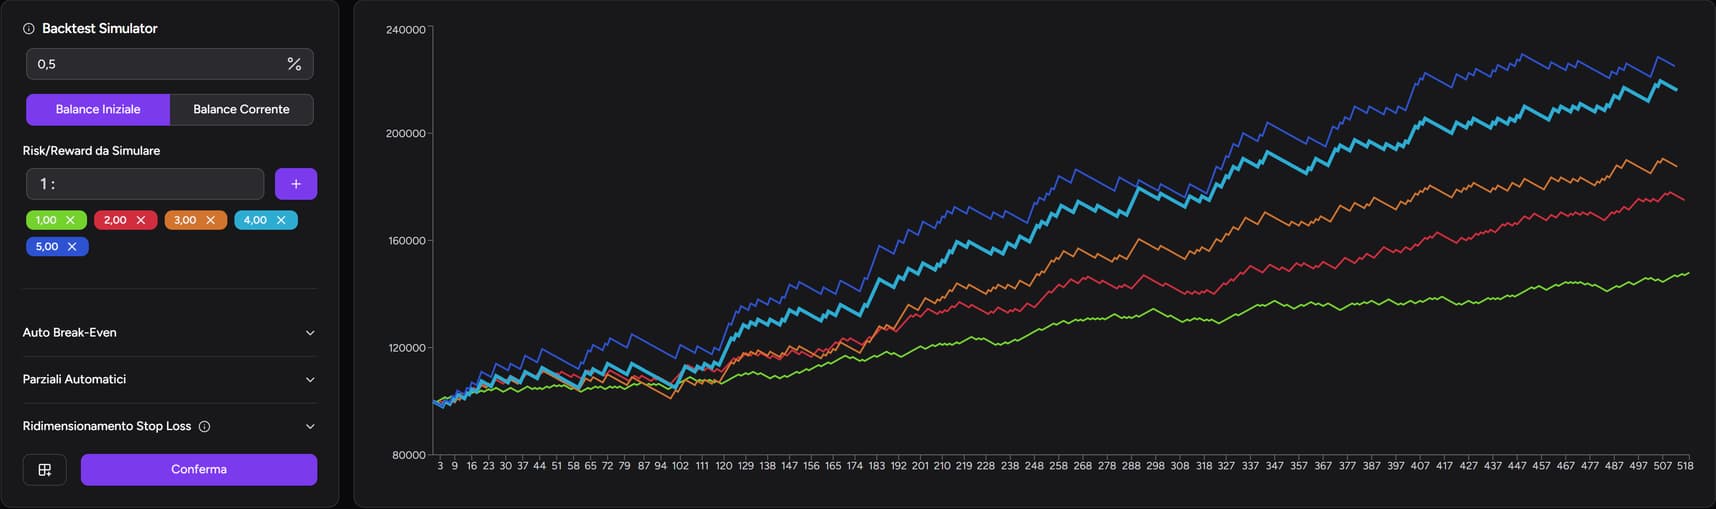
The TotalTrade Backtest Simulator recalculates a session's trades with different parameters, including Auto Break-Even, risk/reward ratios and partials. To isolate break-even:
- keep risk, targets and partials unchanged;
- run one simulation without Auto Break-Even and one with it;
- compare profit, drawdown and the counts of stop losses, take profits and Auto BE exits.
A curve with a smaller drawdown can be appealing even without the highest profit, depending on how much drawdown you're prepared to accept. Just remember that a fixed threshold doesn't reproduce a decision made by reading price structure.
Replay and the Simulator both live in the TotalTrade Backtester: the first to practice management on the chart, the second to compare alternatives you can express as parameters. To read the comparison, see win rate, profit factor and drawdown.
FAQ
Does break-even reduce risk?
It lowers the maximum loss on a single trade after the stop moves, but it can also lower the strategy's overall profit. Judge it on results across many trades, not one.
Break-even or trailing stop?
They're different rules: break-even moves the stop once, a trailing stop follows price continuously. Both share the same trade-off between losses avoided and moves cut short, so test them on your own trades.
At how many R should I move my stop?
There's no universal value. Compare several thresholds on the same trades, changing one parameter at a time, and check the result on a different period from the one you used to choose it.
For information and education only, not financial advice. Backtest and simulation results do not guarantee future performance. Leveraged trading carries a high risk of loss.