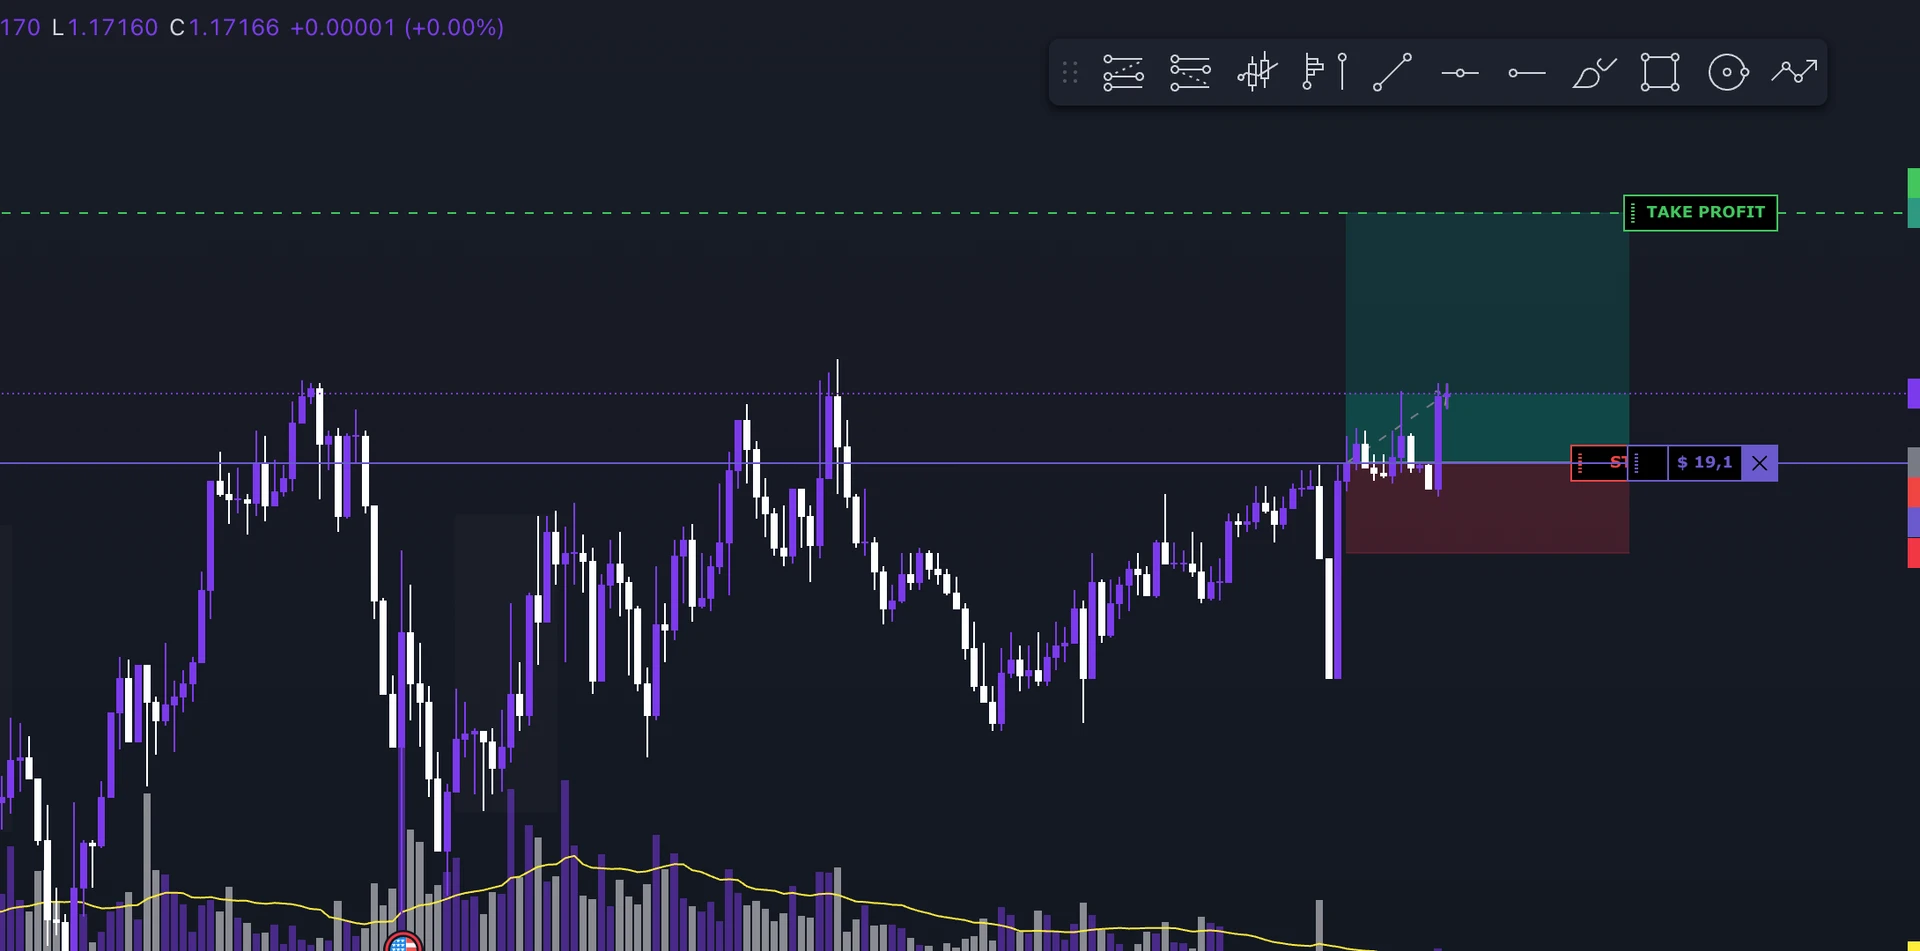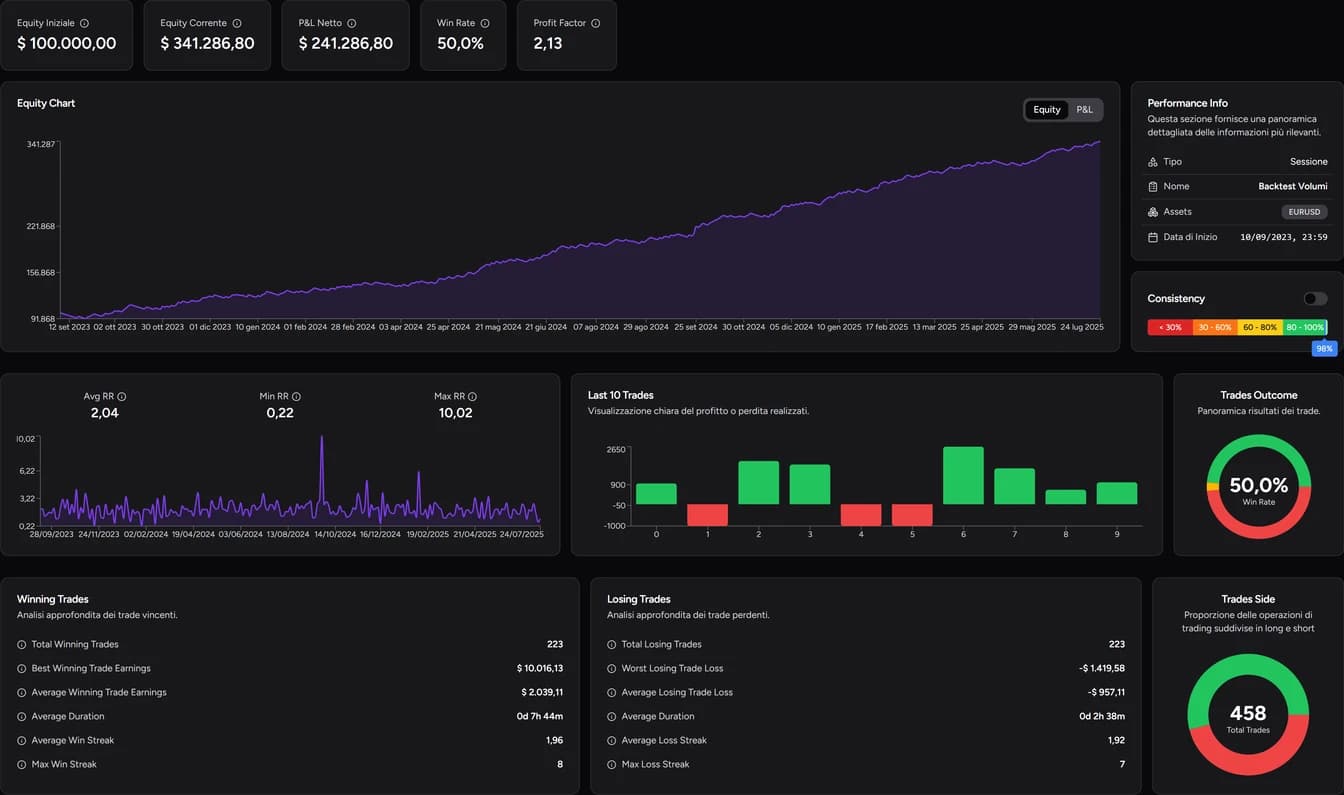
Screenshots show the Italian app interface; controls are explained in the language of this guide.
Backtest Simulator is included in Pro and Ultra. See the plan comparison for other features.
The Backtest Simulator recalculates the trades from a backtest session under different management rules and shows how the result would have changed. For example: a 2R target instead of 3R, automatic break-even on or off, or a partial at +1R. You don't rerun the test; you start from the trades you've already logged and compare scenarios in a table and on several equity curves.
It's different from manual replay. In replay you manage each trade as price moves; in the Simulator you apply fixed parameters to every trade and measure their effect.
Before you start: open a backtest session that contains trades the simulation can use.
1. Open the Simulator
From the Backtest list, open the session menu and select Analytics. The Simulator tab sits next to Statistics and History. Parameters are in the left panel; once you run it, you'll see the curves and the Simulation Result table.
Don't confuse it with the Equity Curve Simulator in the statistics. That tool works from statistical assumptions (win probability, number of trades); the Backtest Simulator uses your session's actual trades.
2. Choose how risk is calculated
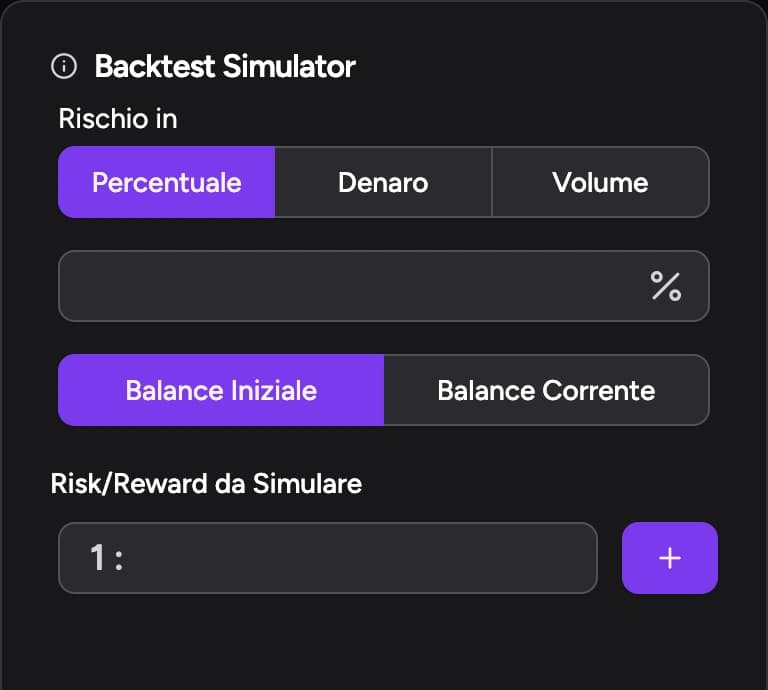
Under Risk in, choose Percentage, Money or Volume and enter the value.
With a percentage you also pick the base:
- Initial Balance: 1% of $10,000 stays $100 for the whole session;
- Current Balance: 1% tracks the account, so at $11,000 it becomes $110.
With Volume the position size stays fixed and cash risk depends on stop distance: the same size with a wider stop means a larger potential loss.
If you only want to measure the effect of exits, keep the same risk setting across all scenarios, and compare position sizing separately.
3. Add risk/reward ratios
In Risk/Reward to Simulate, type the value after "1 :" and press +. Repeat for each scenario: entering 1, 2 and 3 gives you 1:1, 1:2 and 1:3.
A more distant target pays more when it's hit, but fewer trades reach it. The result depends on both. With exits only at −1R or +2R, before costs, one winner covers two losers, so you break even at a win rate of 1/3, about 33.3%. Break-even and partials change the outcomes, and with them that threshold.
4. Set break-even, partials and stop loss
- Auto Break-Even moves the stop to entry automatically. Compare the simulation with and without it, keeping everything else equal. Our article on when to move your stop to break even explains what to expect.
- Automatic Partials: click Click to Add Partials and fill in the level. Closing 50% at +1R and 50% at +2R gives +1.5R before costs.
- Stop Loss Resizing changes the stop distance in the simulation. Read it together with "Risk in": changing distance at fixed volume is not the same as changing it at fixed risk.
To know which change makes the difference, adjust one parameter at a time. If you change targets, risk and partials together, the result describes the combination, not any single choice.
5. Read the table and the curves
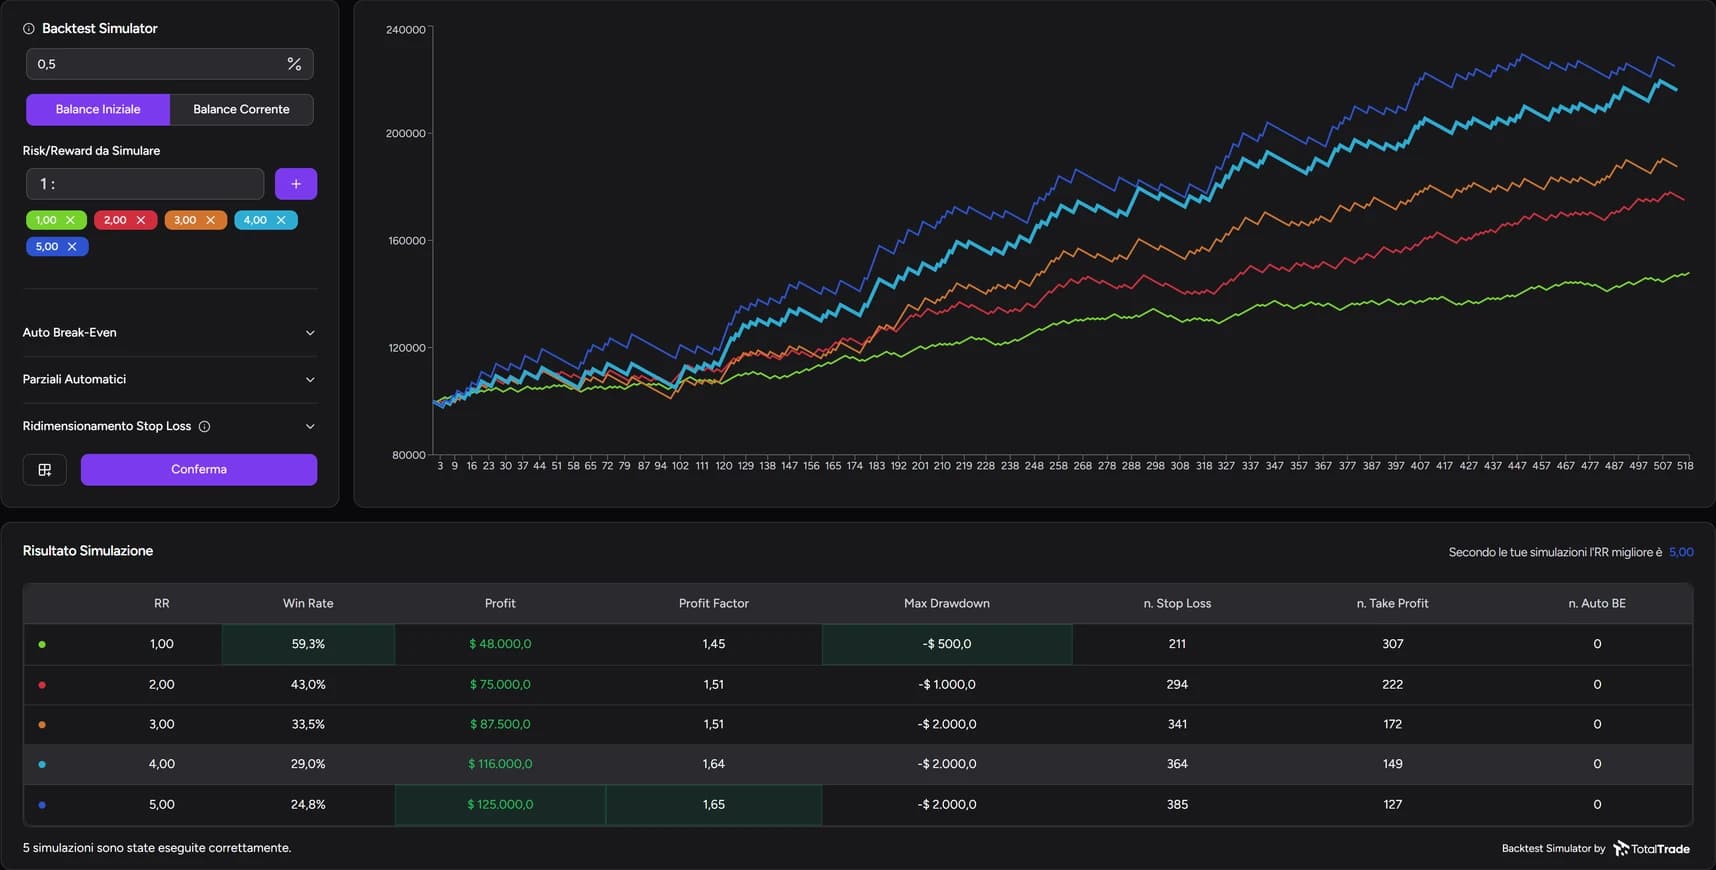
Click Confirm to run the simulations. For each scenario the table shows:
| Column | What it tells you |
|---|---|
| RR | The simulated risk/reward ratio |
| Win Rate | How often trades win |
| Profit | The scenario's result |
| Profit Factor | Gross profit divided by gross loss |
| Max Drawdown | The largest fall from a peak |
| Stop Loss / Take Profit / Auto BE | How many trades exited each way |
The exit counts are especially useful with break-even: you may see fewer stop losses but also fewer take profits, because some trades exited before reaching either level. The counter below the table shows how many simulations completed. If results are missing, check your parameters and available trades, and don't read an empty table as a zero result.
The curves show where in the session the differences come from. A scenario might only win thanks to a few favorable weeks. To interpret the metrics, see win rate, profit factor and drawdown.
6. Check before changing your rules
A management rule that works on one session may simply reflect that period's price action. Before adopting it:
- repeat the comparison on other sessions and periods;
- account for real costs and execution, which the test doesn't fully capture;
- remember the Simulator applies fixed rules; discretionary chart-based exits belong in replay.
FAQ
Can the Simulator reproduce my discretionary exits?
No. It applies the parameters you set to every trade in the session. A decision made by reading the chart mid-trade should be evaluated in replay, where you manage the position yourself, and reviewed afterwards with Trade Review.
How is it different from the Equity Curve Simulator?
The Equity Curve Simulator generates scenarios from statistical assumptions such as win rate and trade count. The Backtest Simulator recalculates your session's actual trades under different management rules.
Which scenario should I pick if none wins on every metric?
Decide first what matters most to you: profit, drawdown or consistency. A scenario with slightly lower profit and a much smaller drawdown may be preferable, as long as it stays positive after costs and on other sessions.
For information and education only, not financial advice. Backtest and simulation results do not guarantee future performance. Leveraged trading carries a high risk of loss.