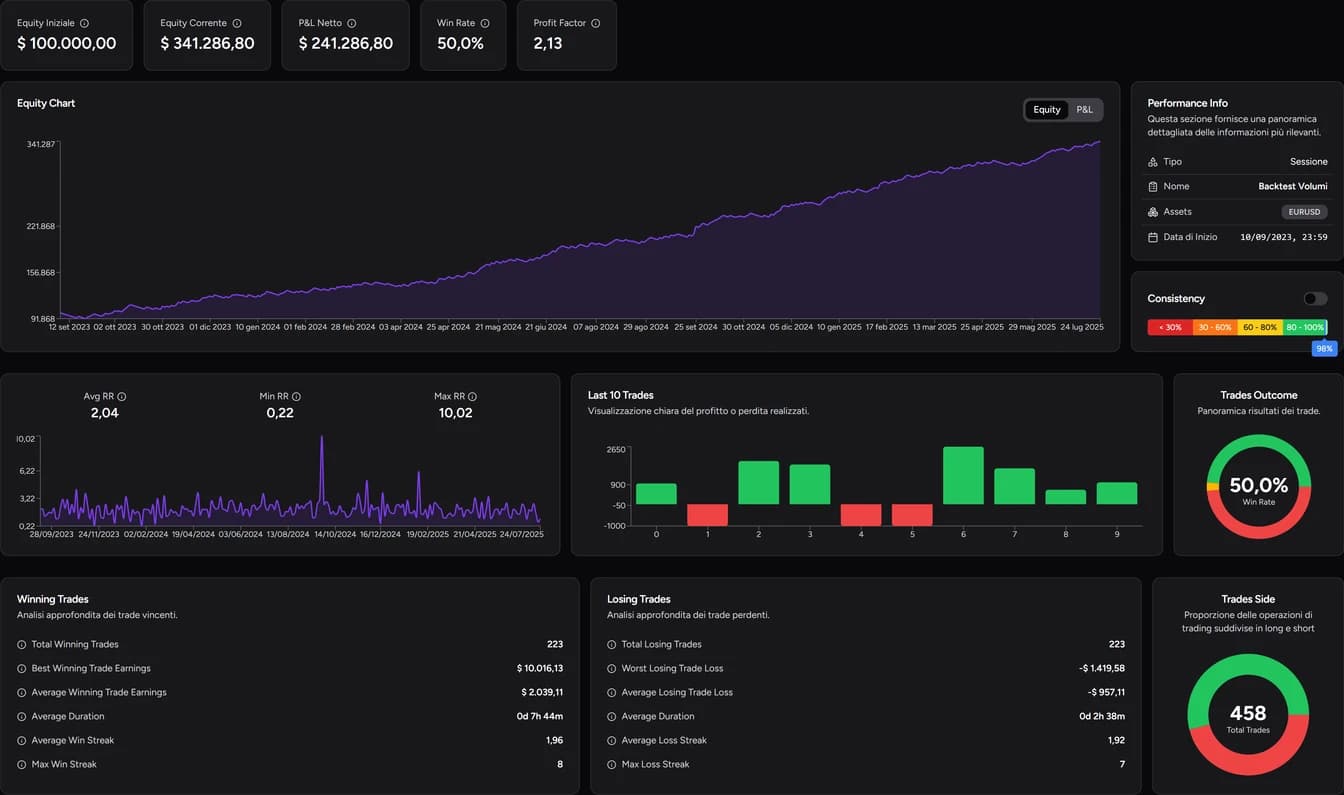
A profitable backtest isn't enough to judge a strategy. You need four numbers read together: win rate (how often you win), profit factor (how much you make relative to what you lose), expectancy (the average result per trade) and drawdown (how far the account falls from its peak). A high win rate can coexist with a loss, and a strategy can make money while stopping out on more than half its trades.
Win rate and profit factor
Win rate is the share of trades closed in profit: 40 winners out of 100 trades is a 40% win rate. It tells you how often you make money, not how much.
Profit factor is calculated as:
Profit factor = gross profit ÷ absolute value of gross loss
Take 100 trades before costs: 40 winners of +$200 and 60 losers of −$100.
- Gross profit: 40 × 200 = $8,000
- Gross loss: 60 × 100 = $6,000
- Net result: +$2,000
- Profit factor: 8,000 ÷ 6,000 = 1.33
For every dollar lost you made about $1.33. Above 1, profits exceed losses in that sample; below 1, the opposite. The win rate is under 50%, but the average win is twice the average loss.
Expectancy: the number that sums up your edge
Expectancy is the average result per trade:
Expectancy = win frequency × average win − loss frequency × average loss
Calculate both frequencies over all trades. If there are no zero-result trades, loss frequency equals 1 − win rate. Include zero-result trades in the total; the break-even thresholds below assume only wins and losses, with averages measured on the same basis.
In the example: 0.40 × 200 − 0.60 × 100 = $20 per trade, the same as 2,000 ÷ 100. It's not what you'll earn on each trade; it's the average across the sample.
This gives you a useful rule, the break-even win rate. With a ratio R between average win and average loss, a strategy breaks even at a win rate of 1 ÷ (1 + R).
| Win/loss ratio (R) | Break-even win rate |
|---|---|
| 1 | 50.0% |
| 1.5 | 40.0% |
| 2 | 33.3% |
| 3 | 25.0% |
If your win rate sits close to that line, costs alone can wipe out your edge.
Net results: how much costs matter
Add $8 of costs per trade. Across 100 trades that's $800: profit drops from $2,000 to $1,200 and expectancy from $20 to $12.
Applied trade by trade, winners become $192 and losers $108. Profit factor falls to 7,680 ÷ 6,480, about 1.19. The win rate stays at 40% because no trade changed sign.
Two checks before subtracting a cost:
- make sure it isn't already included in the result, or you'll count it twice;
- remember that variable spreads and slippage can cost more live than a backtest reproduces, especially when your average win is small.
Drawdown and recovery time
Drawdown measures how far equity falls below a previous peak:
Drawdown % = (previous peak − current equity) ÷ previous peak × 100
If the account grows from $10,000 to $12,000 and then falls to $10,800, the drawdown is $1,200, or 10%, even though you're still above your starting balance.
Maximum drawdown is the deepest fall in the period. Look at its duration too: losing 10% and recovering in a few trades is very different from staying below your peak for months, even with the same final result.
How the curve is built also matters. Balance counts closed trades only; equity includes open positions. A trade that recovers before closing can hide a large adverse excursion in a balance-only report.
Past drawdown is not the worst loss you can face in the future. To get a feel for the range of outcomes the same statistics can produce, try the Equity Curve Simulator.
Which trades drive your results
After the summary, look for the trades that move the numbers.
- A few very large winners. If almost all profit comes from two trades, review them. They may be exactly the moves your strategy is designed to catch, as in trend following, or outcomes produced with unusually high risk.
- One outsized loss. It could come from larger size, a moved stop or execution. Opening the trade tells you which.
- Groups that are too small. An average over 4 trades can change with the fifth. Before comparing setups or time windows, check how many trades each group contains.
From metrics to trade review
Metrics tell you where to look; the review tells you what happened. Say many losses come from early entries. Reviewing the charts shows whether you acted before your confirmation, or followed the plan and got stopped anyway. A losing trade isn't necessarily a mistake, and a winning one doesn't prove the decision was right.
In the TotalTrade Backtester you move from Analytics to Trade Review with notes and screenshots (see the trade review guide). If the question is about management, compare alternatives with the Backtest Simulator or study the effect of moving your stop to break even.
FAQ
What is a good profit factor?
It depends on the strategy, costs and number of trades. A value just above 1 leaves little room for real-world costs and execution; a very high value on few trades should be checked on a larger sample before you trust it.
Is a high win rate or a high profit factor better?
Neither on its own. What matters is expectancy after costs, together with a drawdown you can actually live with. A 70% win rate with losses much larger than wins can still lose money.
Should drawdown be calculated on balance or equity?
On equity if you want to include open-position swings. Balance only records closed trades and can understate the risk you actually went through.
For information and education only, not financial advice. Backtest and simulation results do not guarantee future performance. Leveraged trading carries a high risk of loss.