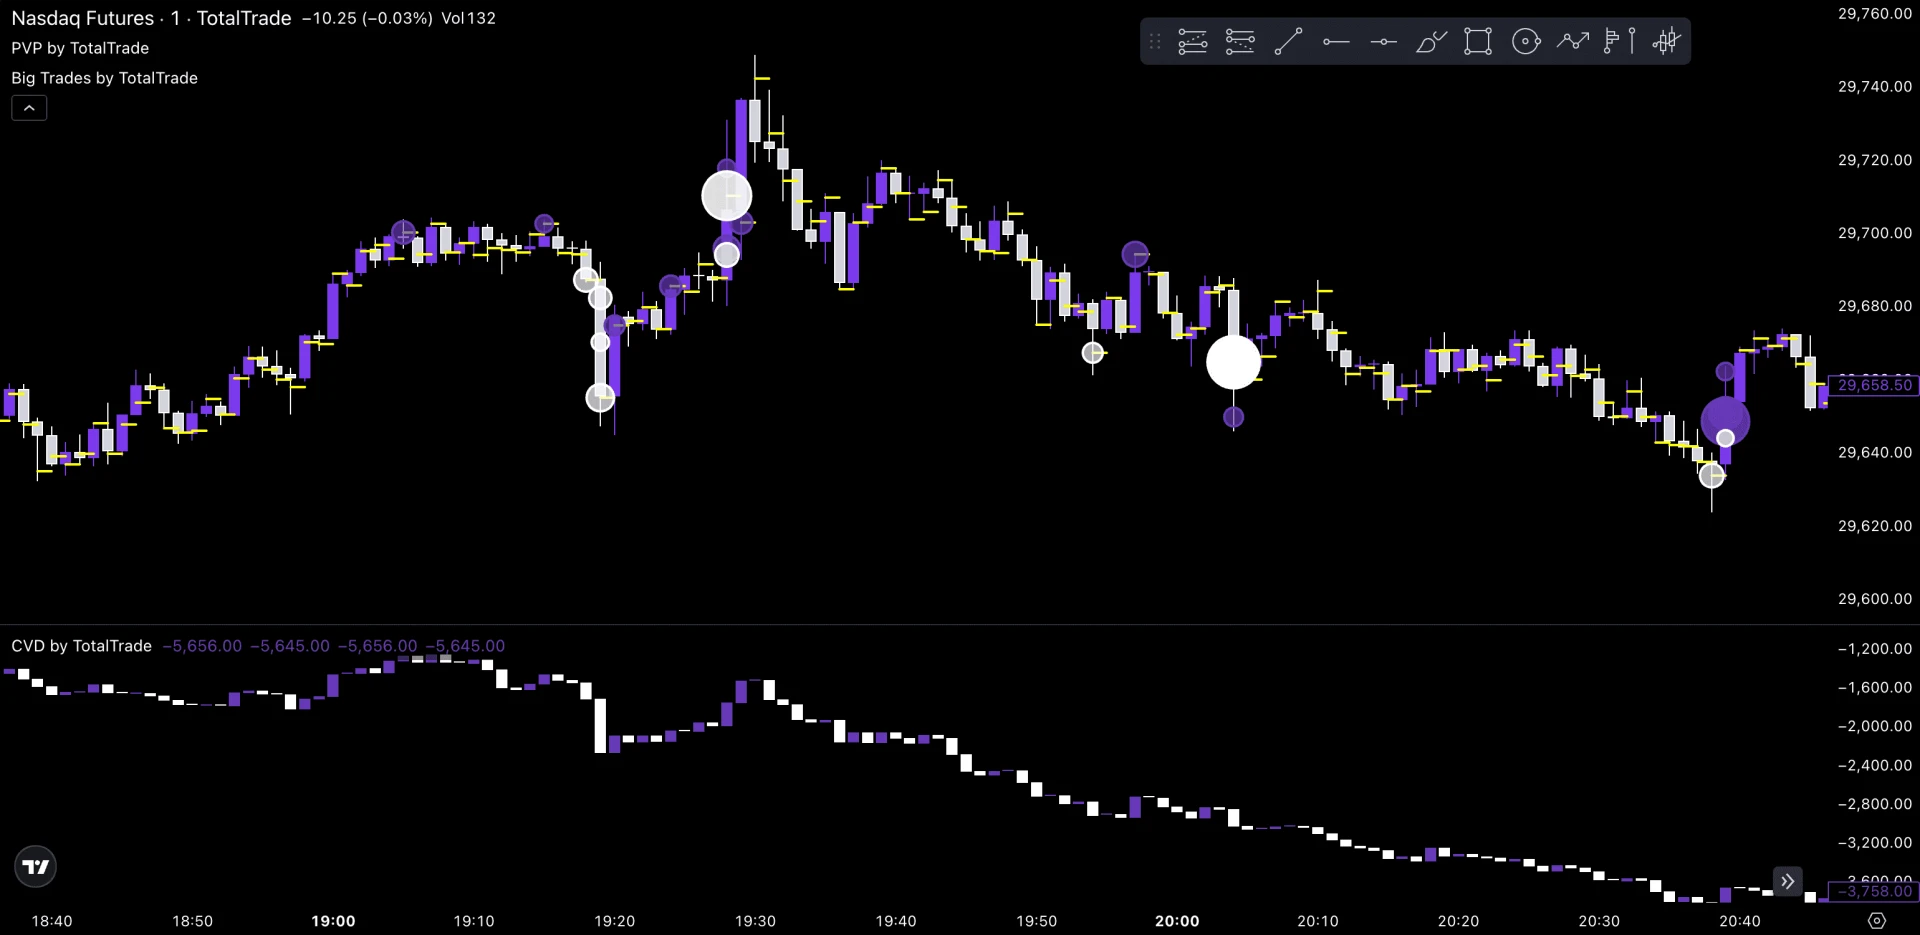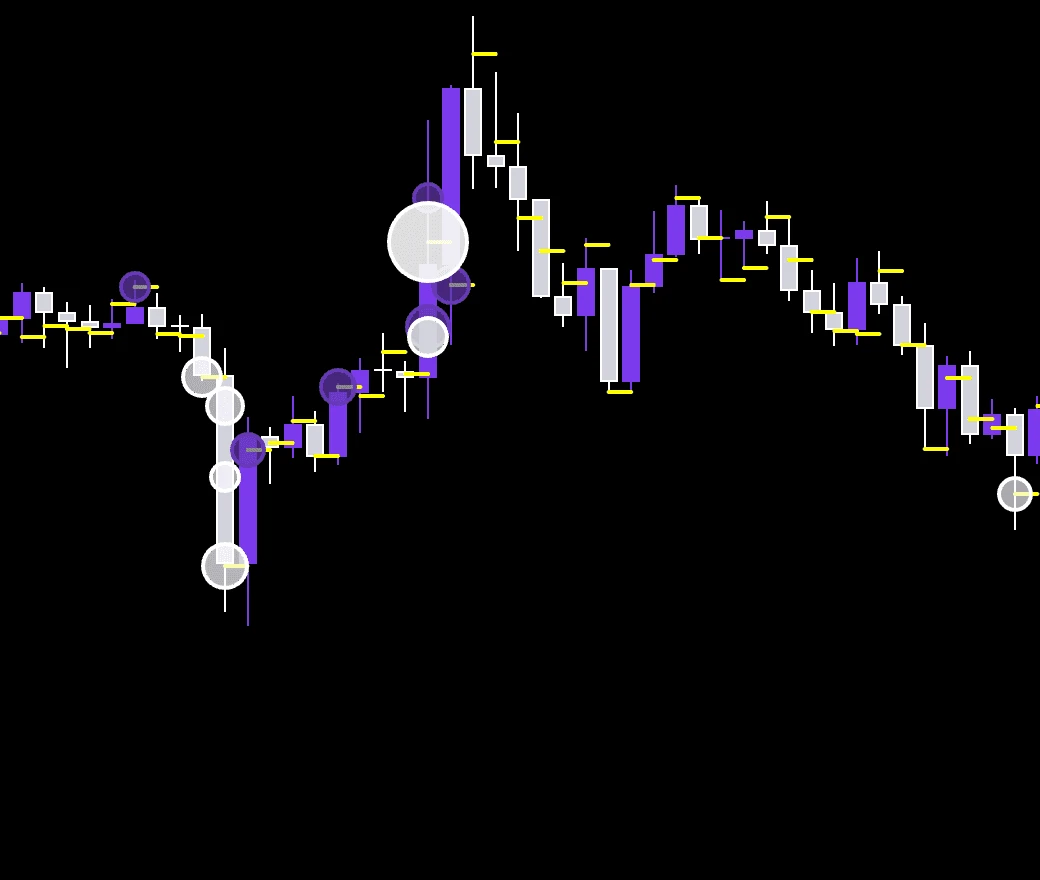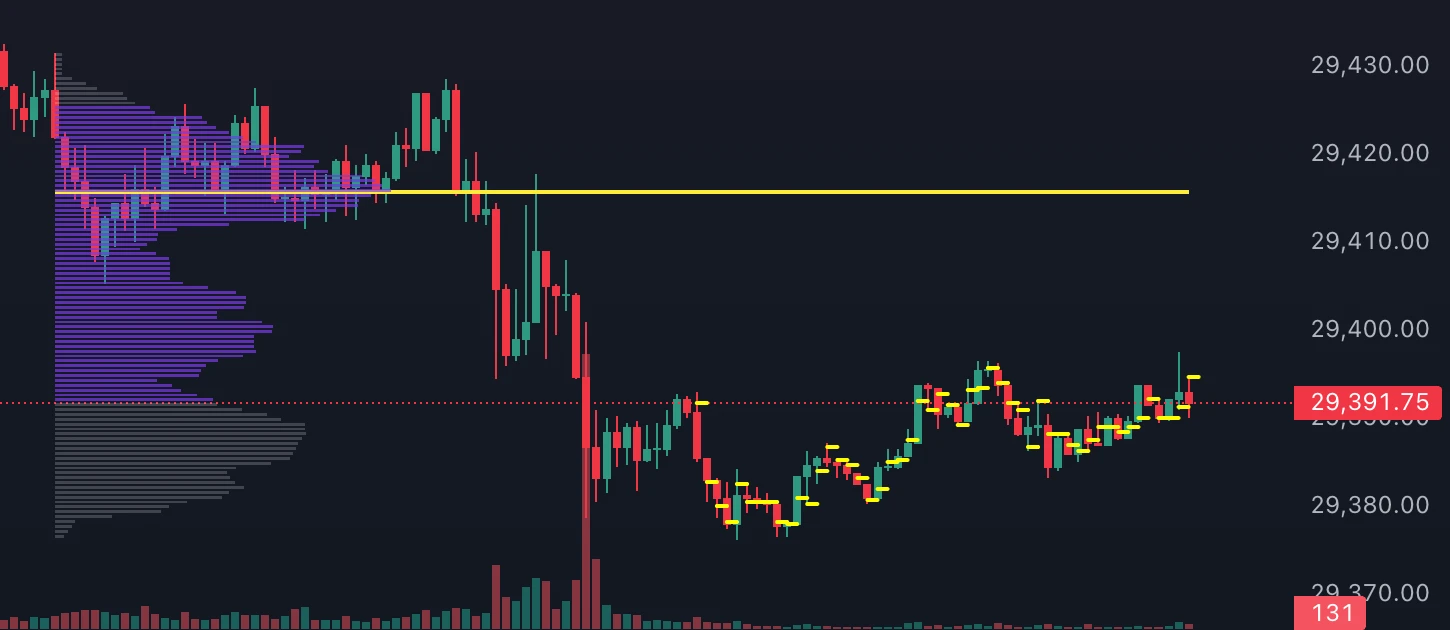
Volume Profile shows how much volume traded at each price over a period. Unlike the volume bars under your candles, it lays activity out horizontally, along the price axis. You can see where the market traded heavily, where it passed through quickly, and which levels summarize the distribution: POC, Value Area, HVN and LVN.
Profile levels at a glance
| Level | What it is |
|---|---|
| POC (Point of Control) | The price or band with the highest volume |
| Value Area | The band containing a chosen share of volume (often 70%) |
| VAH / VAL | Value Area High and Value Area Low |
| HVN (High Volume Node) | Local volume peaks |
| LVN (Low Volume Node) | Areas with less volume than neighboring bands |
The Point of Control
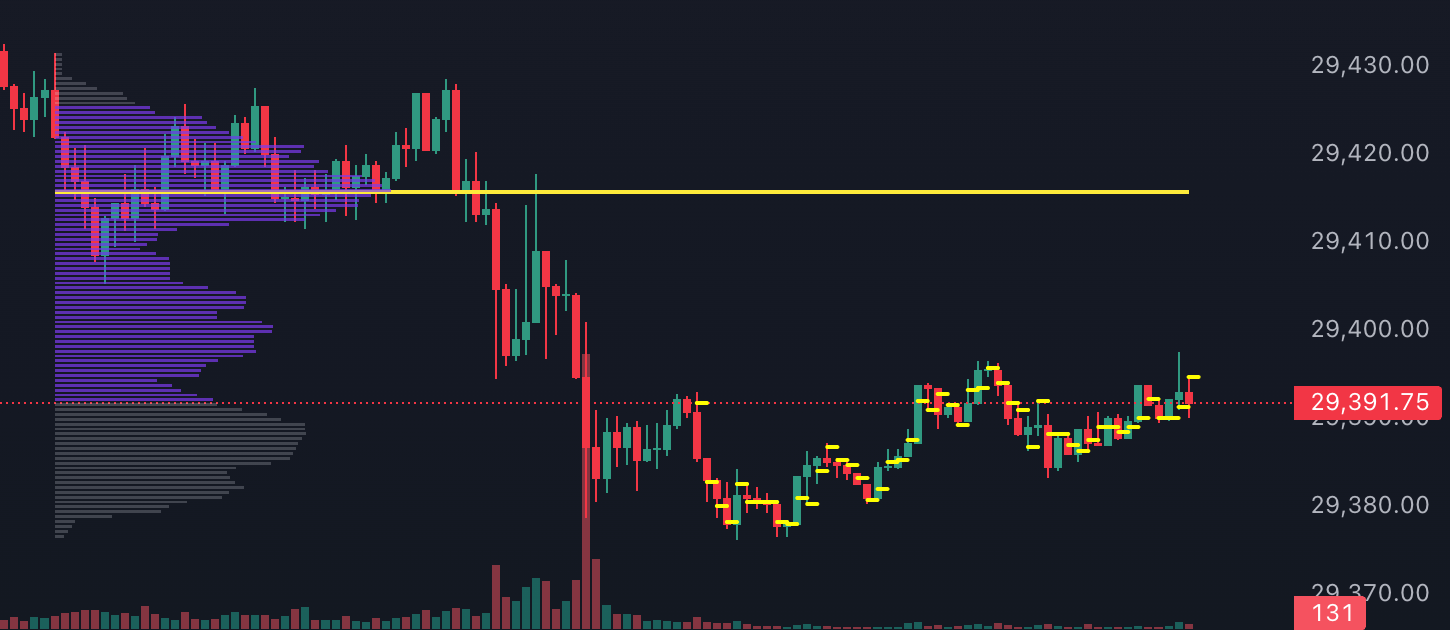
The POC is the longest bar in the histogram: the heaviest concentration of trading in the chosen period.
- It isn't the average price. A weighted average like VWAP uses every price and its volume; the POC only marks where the distribution peaks.
- It depends on the period. A single-session profile and a multi-week one have different POCs, each valid for what it covers.
- It depends on row size. More ticks per row produce wider bands and a coarser reading.
The POC is a reference for watching where price returns and where new volume builds. It isn't a price the market must revisit, nor automatic support or resistance.
Value Area, VAH and VAL
The Value Area holds the percentage of volume set in the profile; 70% is a common choice. With 10,000 contracts in total, a 70% Value Area covers about 7,000, depending on the method and row size.
Two important points:
- 70% of volume isn't a 70% probability that price stays between VAH and VAL.
- In an open session the Value Area moves. The one calculated at the end of the day can differ from what was available in the morning.
When price leaves the area, watch whether it keeps building volume outside or quickly returns.
HVN, LVN and volume migration
A profile can have several HVNs, but only the highest is the POC. HVNs point to balance areas or zones price revisits often; LVNs often separate denser areas and mark bands crossed with little trading.
- Price returning to an HVN may find fresh activity there.
- Price crossing an LVN may move quickly toward the next heavily traded area.
The reaction still depends on the liquidity present on the new visit, not just on past trading.
Watch volume migration too. If new concentrations keep forming higher during a rally, the market is accepting higher prices. That's different from a new high printed on thin trading.
Choosing the profile period
| Profile type | What it describes | When to use it |
|---|---|---|
| Session | One day's activity | Reactions to yesterday's levels |
| Fixed range | A chosen stretch: an impulse, a range, several sessions | Studying a specific structure |
| Visible range | The part of the chart on screen | Quick overview (changes with zoom) |
Volume Profile in backtests: no information from the future
A day's final POC includes afternoon trading, so it can't justify a morning entry in the same session. In a backtest, use:
- the previous session's profile, or
- the profile as it stands at the point the replay has reached.
Either way, your levels must come from trades that had already happened.
The profile depends on the data
On futures, volume counts contracts traded; other feeds may provide tick volume, a count of price updates, which measures something else. Also:
- colored splits in the histogram depend on the method: volume on up and down bars isn't the same as volume traded at the ask and bid;
- TPO (Market Profile) organizes time spent at each price, not contracts traded.
Volume Profile in TotalTrade
The indicator catalog includes Volume Profile Fixed Range, Volume Profile Visible Range and PVP by TotalTrade; the last is built for futures and available on the Ultra plan. In the Backtester you can follow price into profile levels, assess trading in the zone and then review the trade in History. For the wider context, see our guide to order flow trading.
FAQ
Does the POC act as support or resistance?
It can, but not automatically. It's the most traded level of the period, so watch how price reacts when it returns rather than assuming a bounce.
What percentage should I use for the Value Area?
70% is the most common standard. Whatever you choose, keep it the same when comparing sessions or backtests.
Volume Profile or VWAP?
They answer different questions: VWAP is a volume-weighted average price, while Volume Profile shows where volume concentrates. Many traders use both.
For information and education only, not financial advice. Leveraged trading carries a high risk of loss.