The COT Report (Commitments of Traders) is a weekly report from the CFTC, the US derivatives regulator, showing how open futures positions are split across different groups of traders. It lets you see, for example, whether funds are adding to longs as price rises or quietly cutting them. It comes out on Friday with data from the previous Tuesday, so it's a tool for tracking positioning over several weeks, not for intraday timing.
What the report contains
The COT breaks down open interest, meaning contracts still open, into the categories defined by each report format. There are futures-only reports and combined futures-and-options reports.
Open interest isn't volume. Volume counts transactions during the week; the COT is a snapshot of positions still open on the reporting date. A market can trade heavily without a matching increase in open positions.
When it's released and what that means for you
The CFTC publishes the report on Friday at 3:30 pm Eastern Time, with data as of Tuesday that week. Release times can change around US holidays. Use the CFTC release calendar and the actual publication time.
Two practical consequences:
- when you read a fresh report, you're looking at positioning that's three days old;
- in a backtest, the data only becomes usable from the actual publication time of the report, not from Tuesday. Using it earlier means trading on information that wasn't available at the time.
Trader categories
Each format uses its own classification.
| Format | Main categories | Markets |
|---|---|---|
| Legacy | Commercial, Non-Commercial, Nonreportable | All |
| Traders in Financial Futures (TFF) | Dealer/Intermediary, Asset Manager/Institutional, Leveraged Funds, Other Reportables, Nonreportable | Currencies, indices, rates |
| Disaggregated | Producer/Merchant/Processor/User, Swap Dealers, Managed Money, Other Reportables | Commodities |
A few useful clarifications:
- Leveraged Funds covers hedge funds and other leveraged strategies; Asset Manager covers institutional managers.
- Nonreportable positions belong to traders below the reporting threshold and are derived from total open interest.
- Managed Money and Non-Commercial aren't two names for the same series; they come from different formats.
A trader's category reflects their predominant self-reported business purpose, not the reason behind each position. The CFTC itself doesn't know why positions are held. A producer's short may hedge business risk; a fund's short may be speculative or part of a relative-value trade.
Long, short and net positions
The net position is the category's longs minus its shorts.
| Week | Long | Short | Net |
|---|---|---|---|
| 1 | 80,000 | 50,000 | +30,000 |
| 2 (scenario A) | 90,000 | 50,000 | +40,000 |
| 2 (scenario B) | 80,000 | 40,000 | +40,000 |
In both scenarios net rises by 10,000 contracts, but for opposite reasons: in A longs increased, in B shorts decreased. That's why it pays to look at the two underlying series, not just the net line.
A negative net can also improve. Going from −40,000 to −20,000 means the short imbalance halved, even though it's still negative. The sign tells you which way the group leans; the change tells you which way it's moving.
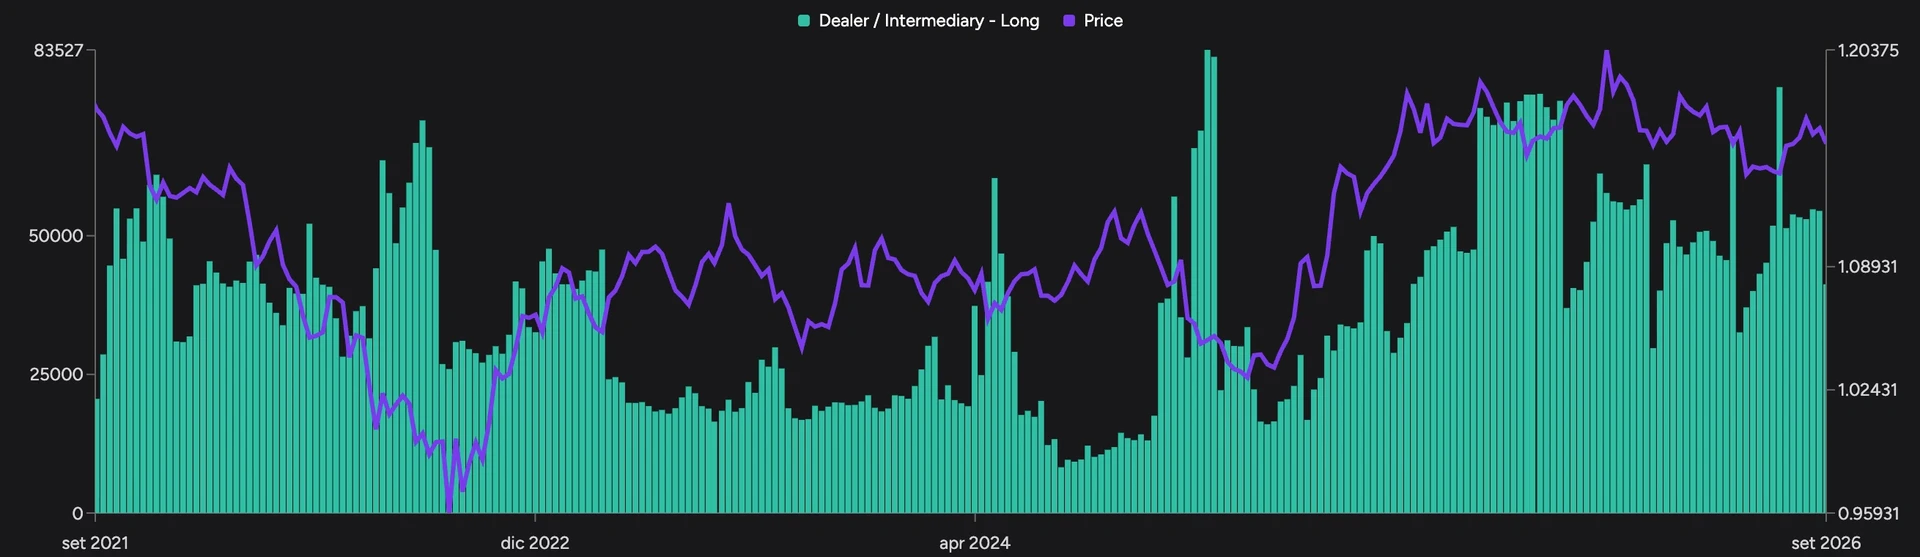
Comparing positioning with price
- Confirmation. During a rally, longs in the group you follow rise for several weeks.
- Divergence. Price makes new highs while the group trims longs. It's something to investigate, not a reversal date.
- Historical extremes. Very lopsided positioning shows one side is already crowded. Watching the subsequent unwind is more useful than assuming the extreme forces a reversal.
Two mistakes to avoid:
- Switching series mid-comparison. Moving to another category, or from futures-only to futures-and-options, changes what you're measuring.
- Forgetting the quote convention. Currency futures are quoted against the dollar: the euro future tracks EUR/USD, while the yen future tracks the inverse of USD/JPY. If the pair you trade is quoted the other way, flip the direction when you compare.
Entries remain tied to price and your own method. The COT is context.
The COT Report in DeepView
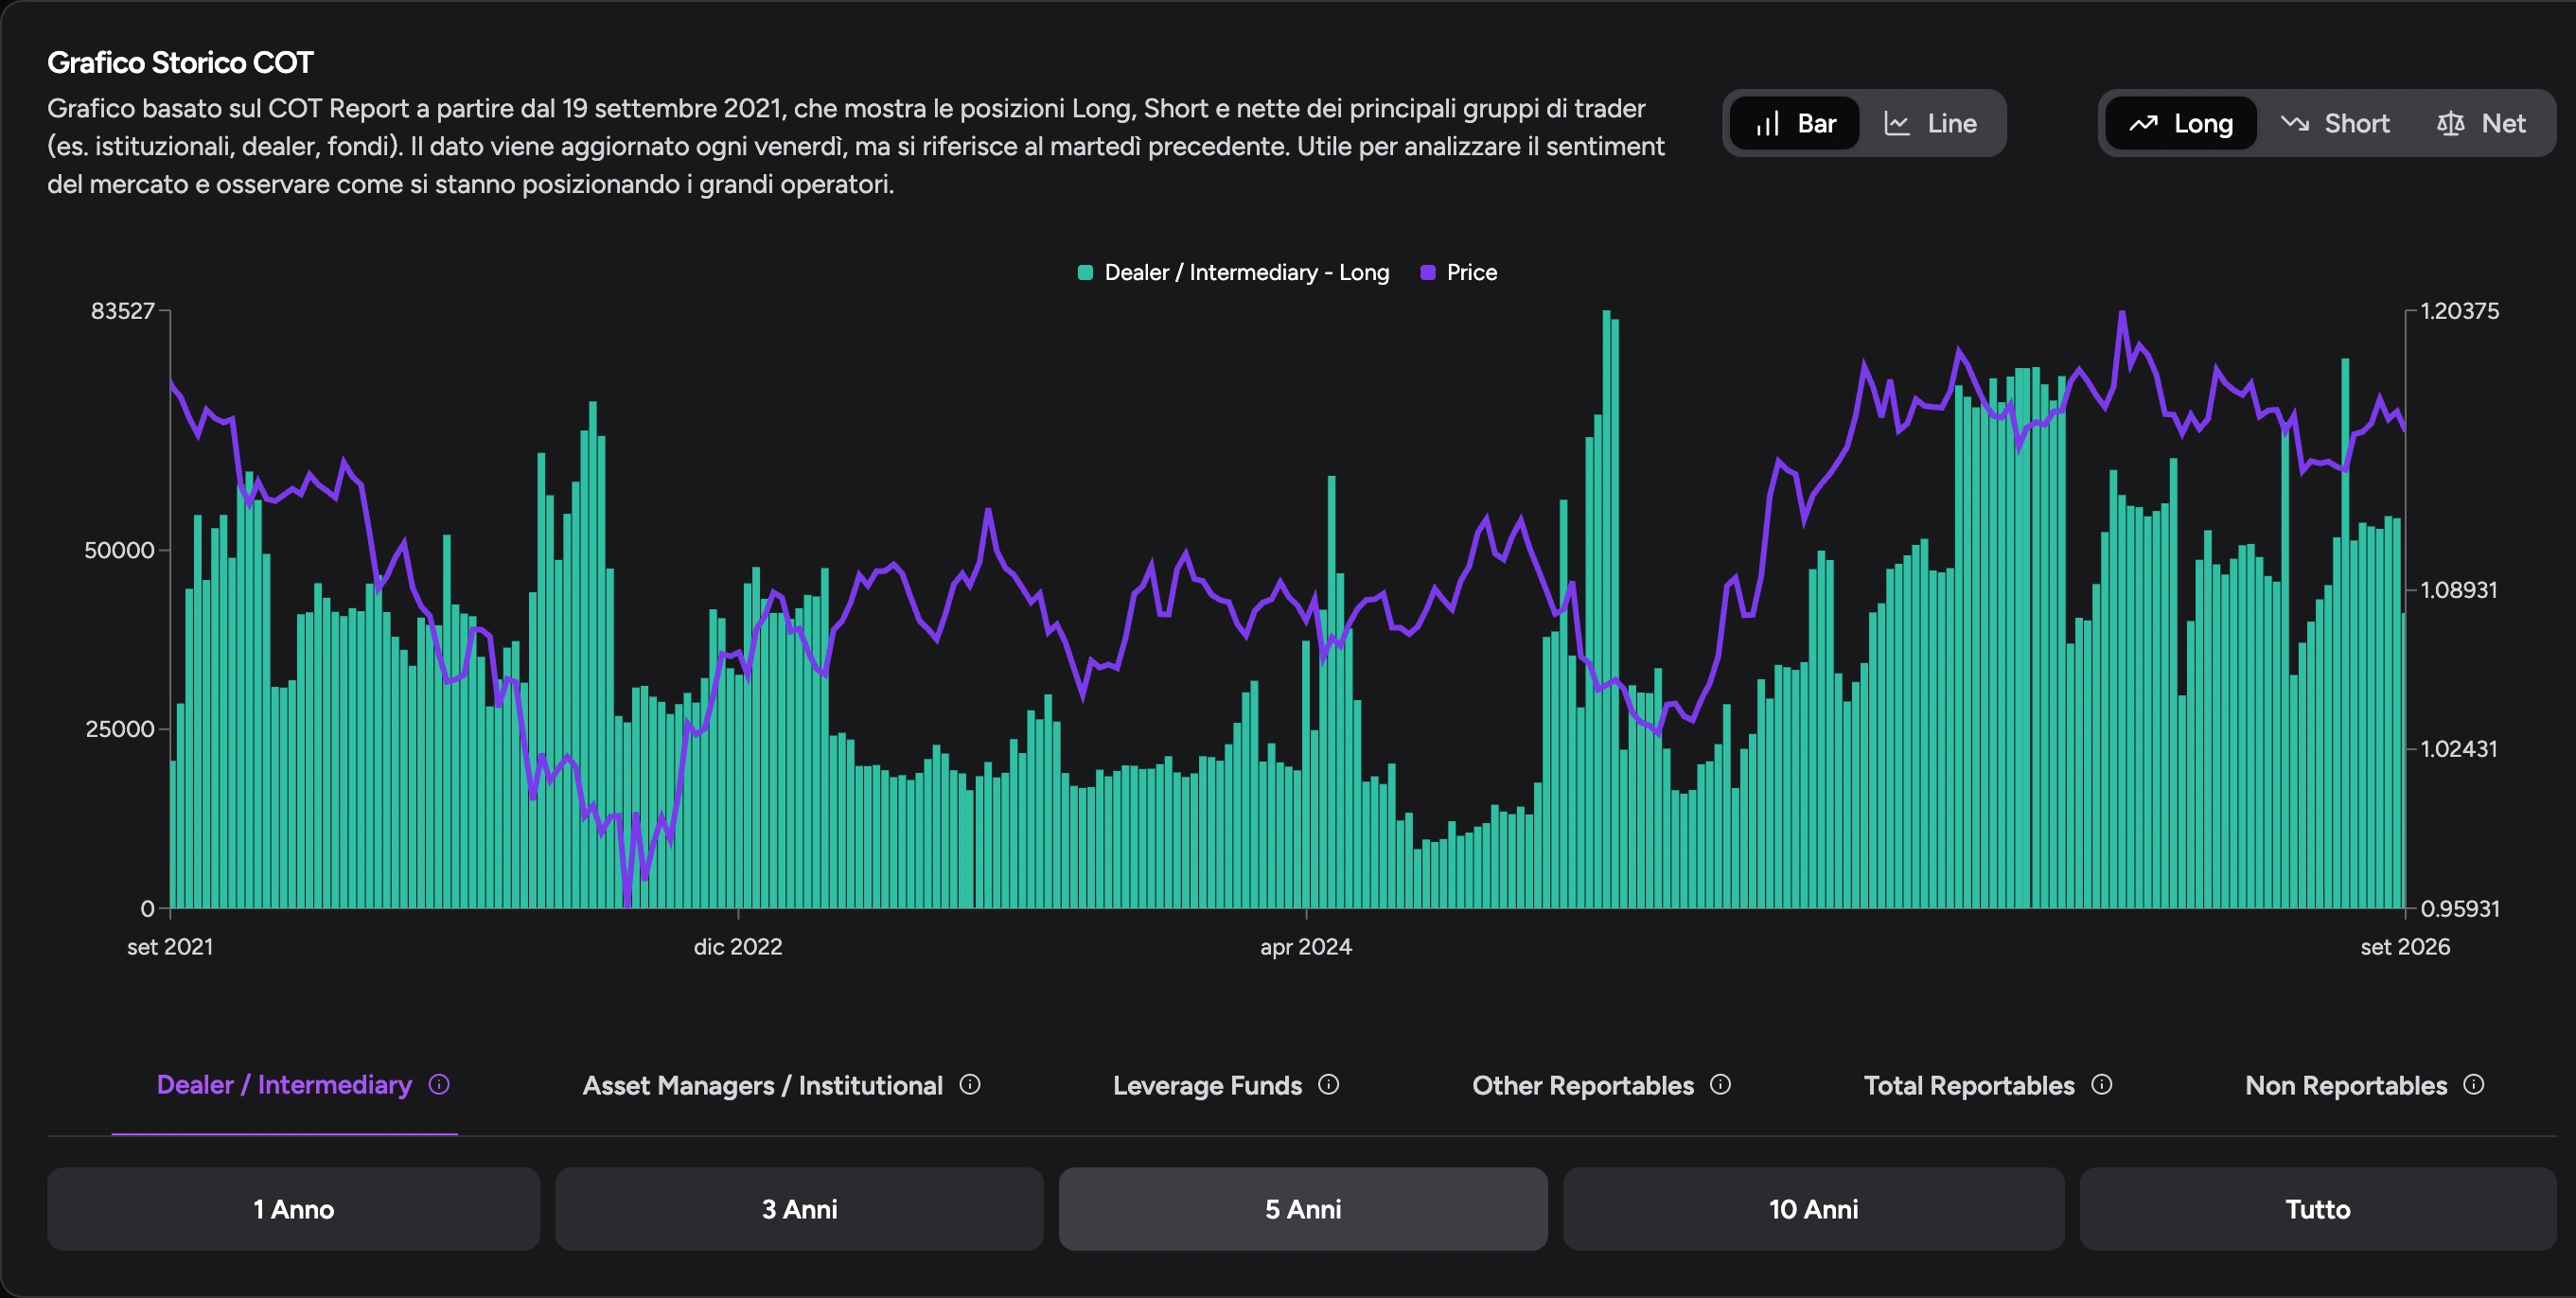
In DeepView you can compare long, short and net series for each available category, view years of history and check a single week's figures in the table. The step-by-step guide is in reading the COT Report in DeepView.
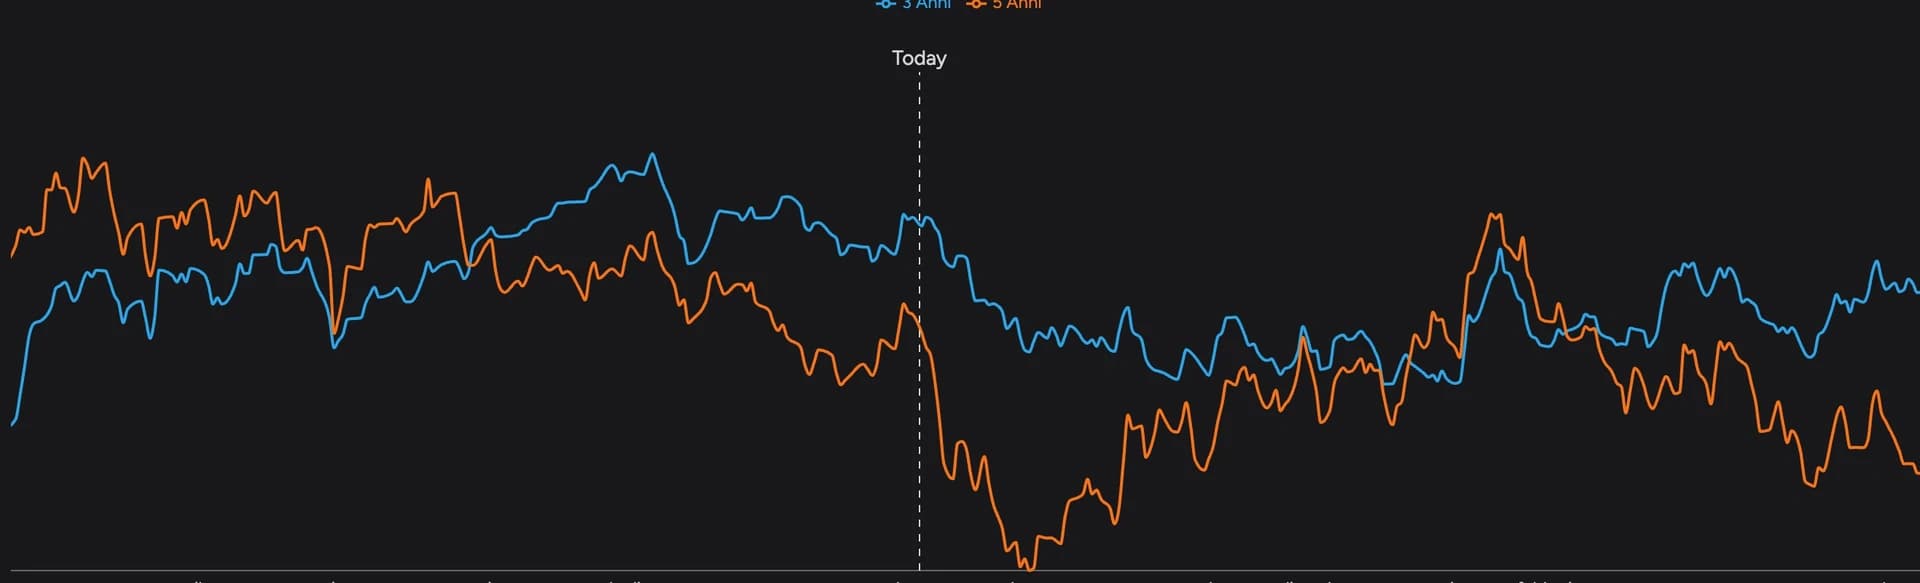
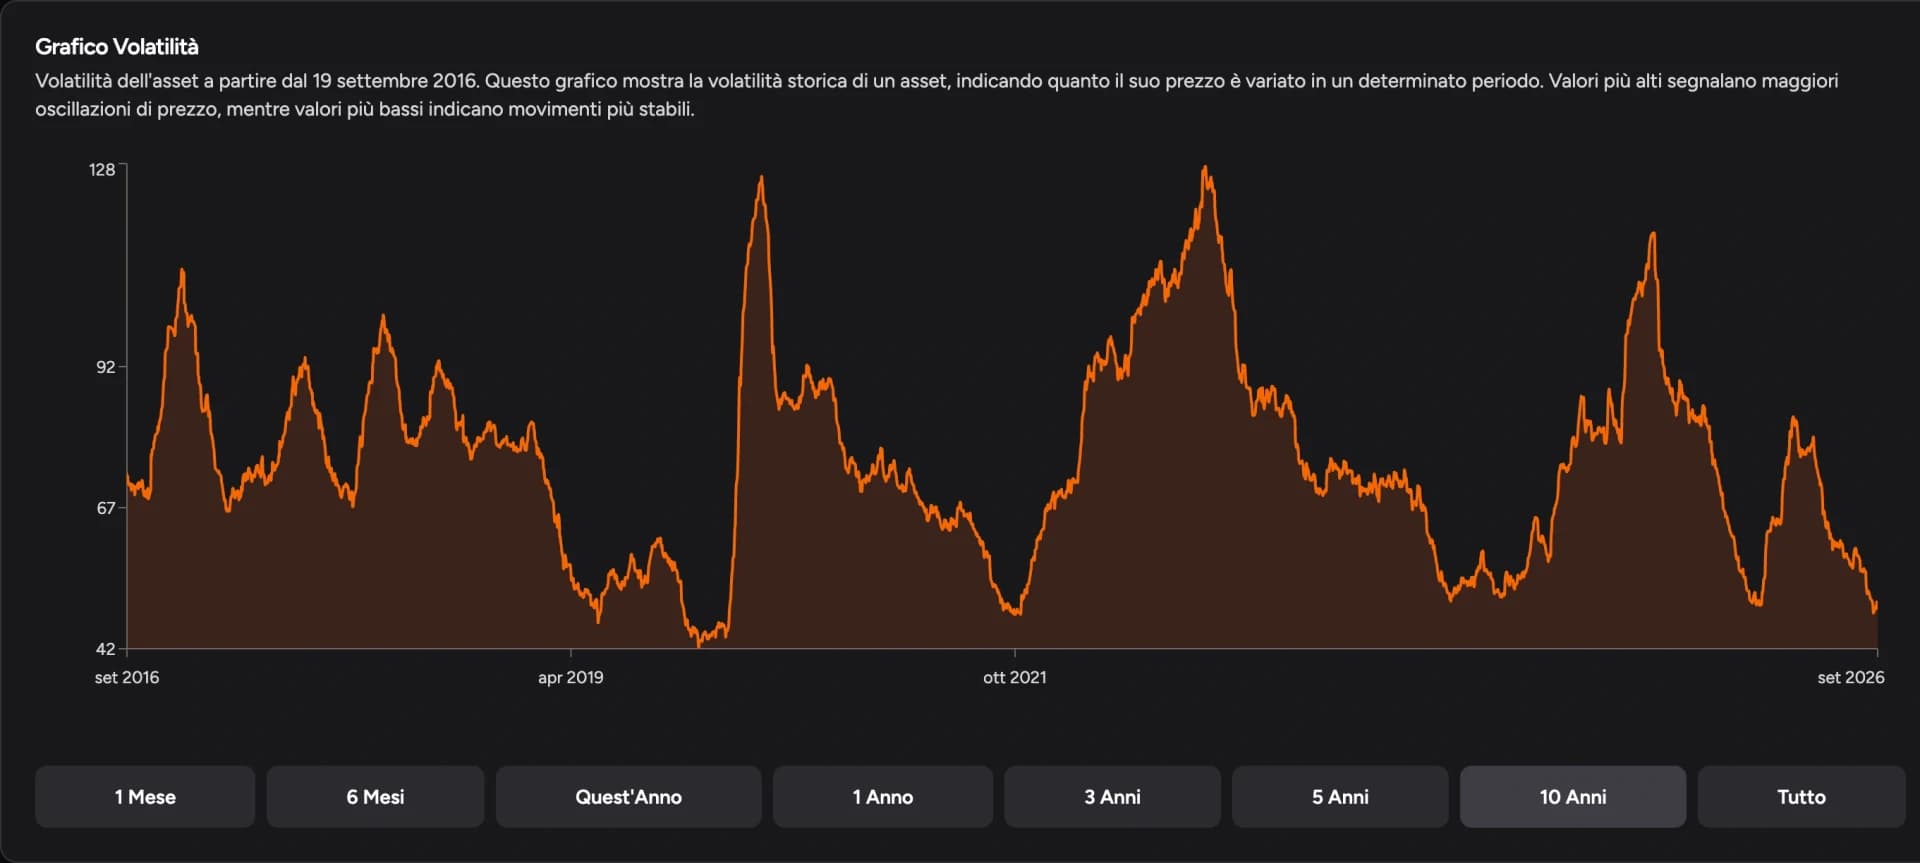
You can pair it with seasonality, which shows how a market has behaved in the same period across years, and with volatility by trading session.
FAQ
Does currency COT data cover the whole forex market?
No. It covers US-listed futures (and options on futures), not spot forex positions. It's still a useful gauge of how certain groups of traders are positioned.
Which category should I follow?
It depends on your question. For financial markets many traders follow Leveraged Funds and Asset Managers in the TFF report; for commodities, Managed Money in the Disaggregated report. What matters is staying on the same series when comparing weeks.
Can I use the COT to time entries?
The report is weekly and three days old on release, so it's for building context, not for deciding the moment to enter.
For information and education only, not financial advice. Leveraged trading carries a high risk of loss.