Screenshots show the Italian app interface; controls are explained in the language of this guide.
In DeepView you can track COT Report positioning by trader category on a historical chart and read each week's figures in a table. This guide uses EUR/USD: open the report, pick a trader group, move from Long and Short to Net, and compare positioning with price. If you need the basics first (categories, open interest, release timing), start with how to read the COT Report.
Open the page: EUR/USD COT Report in DeepView
1. Open the asset's COT Report
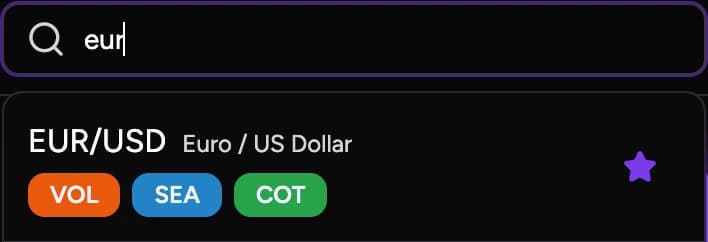
Open DeepView from the app menu and search for the instrument in the top-right field, by symbol or name (for example "EUR"). Next to the results you'll see tags for the available analyses: COT means positioning data exists for that asset.
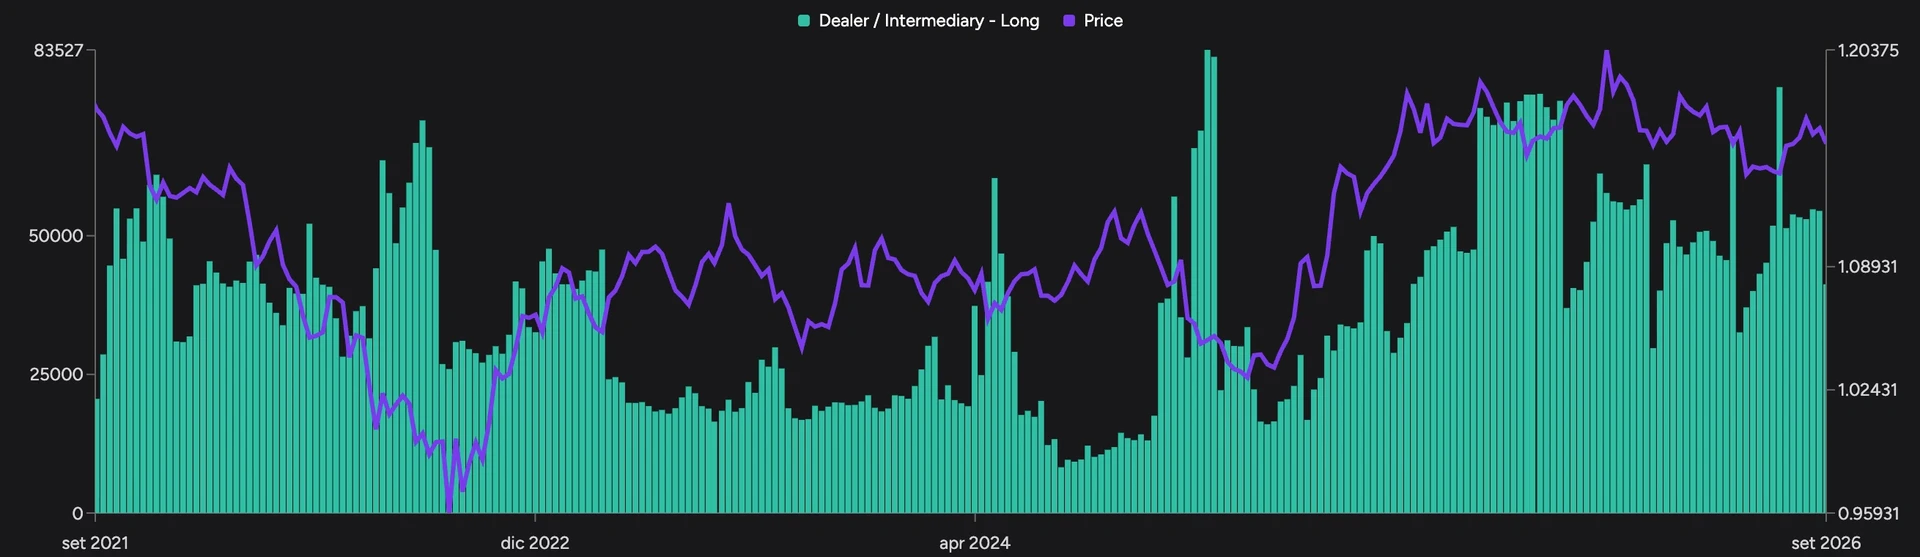
Select EUR/USD and open COT Report under the asset name. The historical chart is at the top; further down, the table shows the detail for a single reporting week.
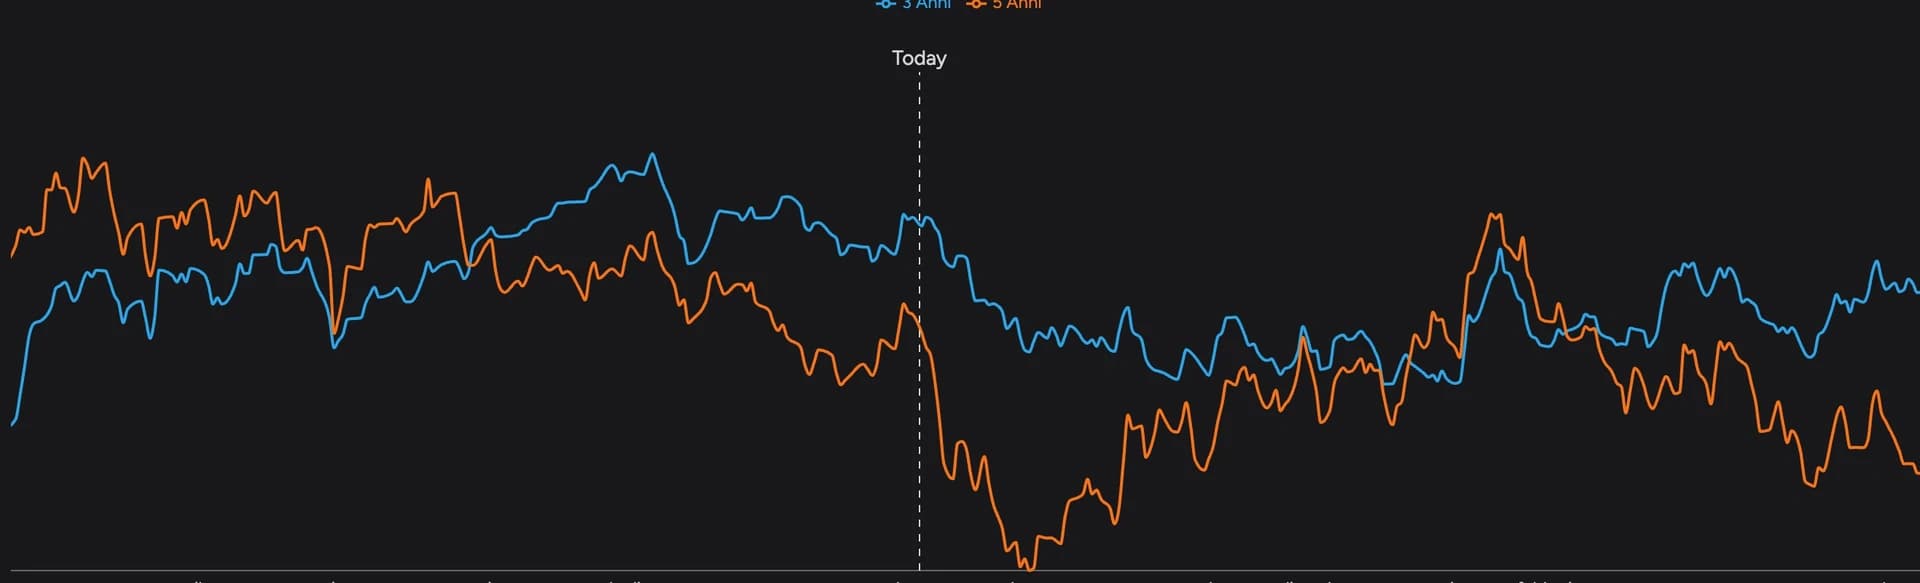
The 1 Year, 3 Years, 5 Years, 10 Years and All buttons change the chart range. Start with the last year for recent changes, then zoom out to compare them with past levels.
2. Pick a trader category
Below the chart are the categories of the financial view. Clicking a group changes the series shown.
| Category | Who it covers |
|---|---|
| Dealer / Intermediary | Intermediaries |
| Asset Managers / Institutional | Institutional managers |
| Leverage Funds | Traders such as hedge funds (CFTC term: Leveraged Funds) |
| Other Reportables | Other traders above the reporting threshold |
| Non Reportables | Positions derived from total open interest minus reported positions |
| Total Reportables | The total of all reporting traders, not a separate group to add to the others |
The category changes what the data means. An intermediary may hold futures to hedge client business, so the sign of its position doesn't necessarily express a market view. When comparing weeks, stay on the same category.
The LEGACY button opens the older format, with different categories such as Commercial and Non-Commercial. It's another view of positioning, but the categories in the two formats aren't equivalent.

3. Use Long, Short and Net
Above the chart are Long, Short and Net: the category's long contracts, its short contracts and the difference between them. Bar and Line only change how the series is drawn.
- Positive Net: longs outnumber shorts. Negative Net: the reverse.
- Negative Net that's rising: the short imbalance is shrinking.
To understand why Net changed, switch to Long and Short. If Net rises while Long stays flat, shorts were cut; if Long grows while Short is stable, the increase came from the long side.
With a multi-year view you can also see how close positioning is to historical highs or lows, which helps you spot an unusually lopsided exposure and follow how it evolves.
4. Read the numbers in the table
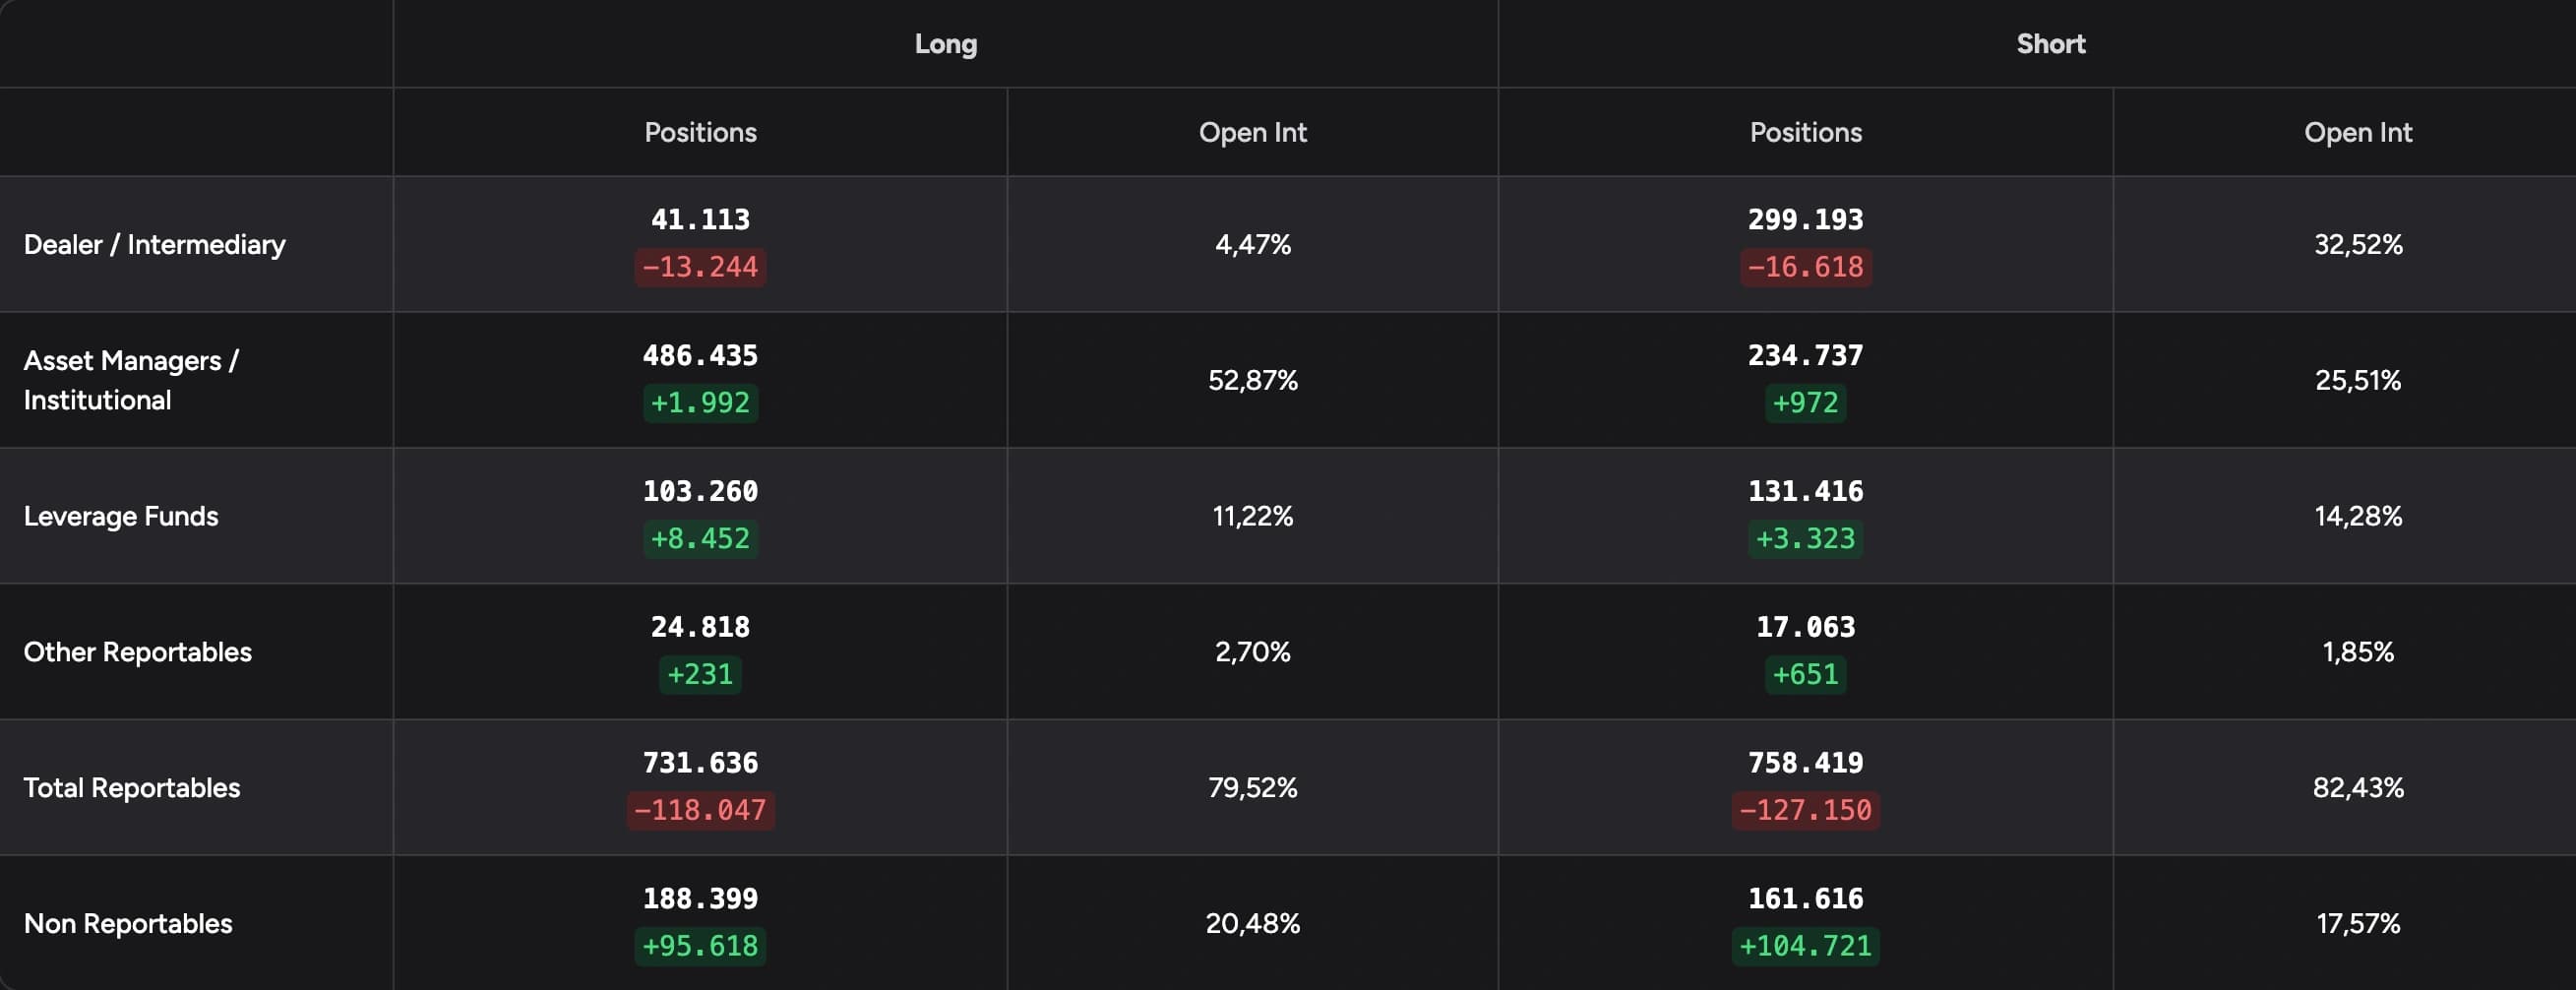
The arrows and date picker change the reporting week. Positions shows the category's contracts; the colored value beneath is the change from the previous week; Open Int is the share of total open interest.
An example from the 15 September 2026 report, Leverage Funds category:
| Contracts | Weekly change | |
|---|---|---|
| Long | 103,260 | +8,452 |
| Short | 131,416 | +3,323 |
| Net | −28,156 | +5,129 |
Both longs and shorts grew, but longs grew more. The group is still net short, with a smaller imbalance than the week before. That's why the sign alone isn't enough: net says "shorts still dominate", the change says "less than before".
5. Compare positioning with price
With category and range chosen, watch how positioning changes as the market moves. Price and positions use separate scales, so compare direction and turning points, not the absolute height of the lines.
- In a rally, check whether the category's longs are growing.
- If price makes new highs while the category trims longs, you have a mismatch worth investigating.
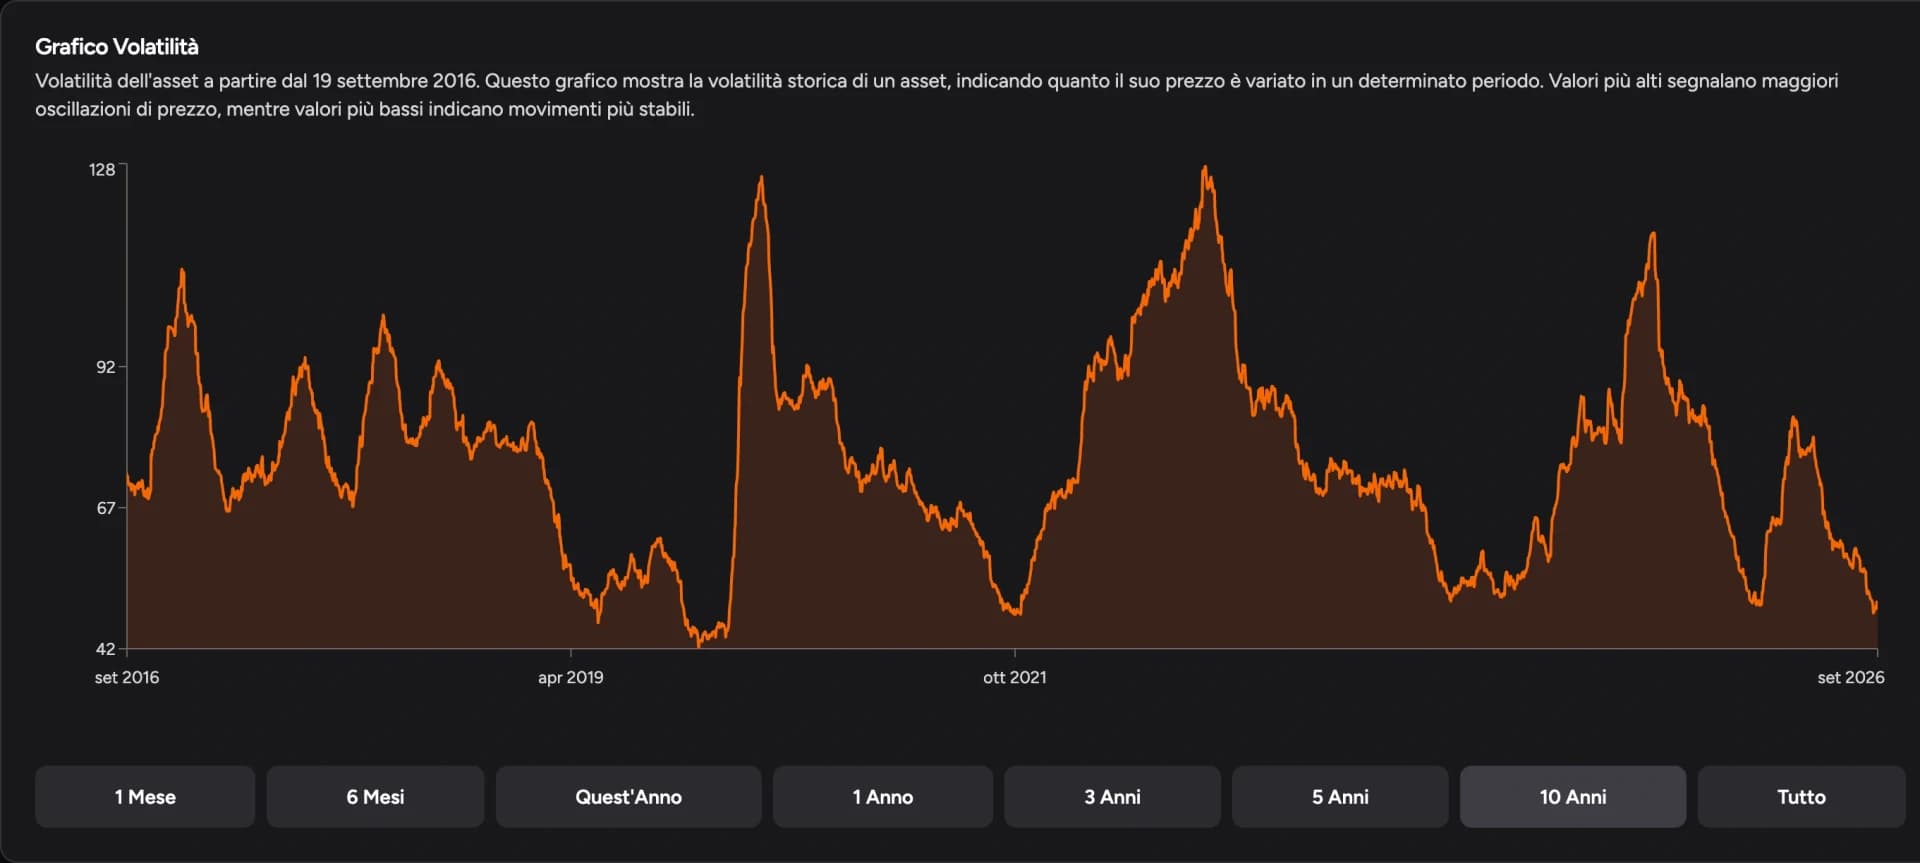
You can then move to seasonality for the time of year or to volatility for the size of moves. The COT feeds your preparation as context; entries and management stay tied to your method and to price, which you can practice in the Backtester.
FAQ
When does a new report become available?
Usually on Friday, with positions as of the previous Tuesday; holidays or CFTC calendar changes can shift it. In a backtest, use the data from its release date, not from the Tuesday shown in the table.
Does currency COT data cover the whole forex market?
No. It covers the derivatives in the report, not spot forex positions. When comparing it with a pair, also check how the future is quoted relative to that pair.
Which category should I watch for EUR/USD?
It depends on what you want to observe. Leverage Funds and Asset Managers are the most widely followed for speculative and institutional positioning; the key is not switching categories while you compare weeks.
For information and education only, not financial advice. Leveraged trading carries a high risk of loss.