Seasonality studies how a market has moved during the same periods across different years, looking for recurring phases of strength or weakness. In trading it helps you decide which markets to watch and which direction to favor at a given time of year. It doesn't tell you which day to enter: that depends on price and your setup.
How to read a seasonal chart
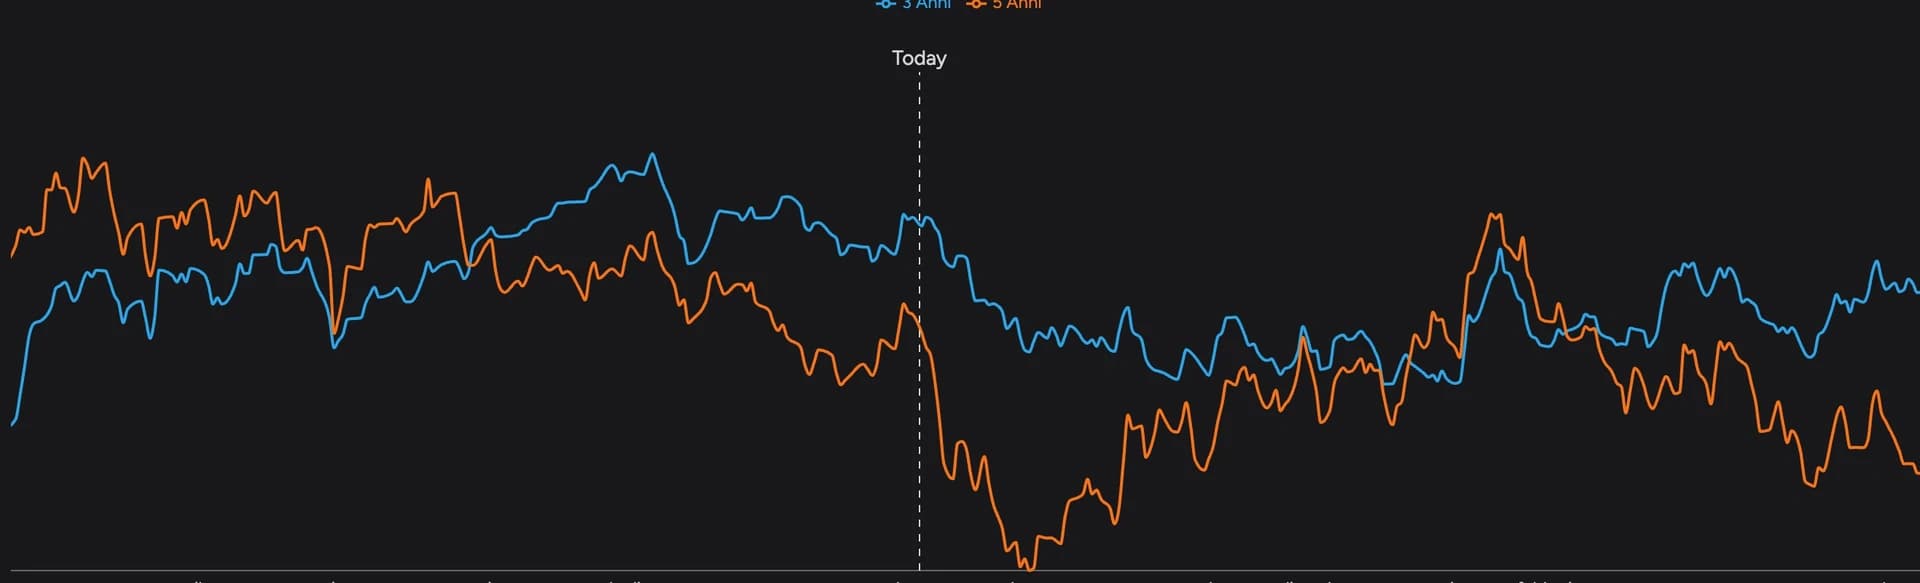
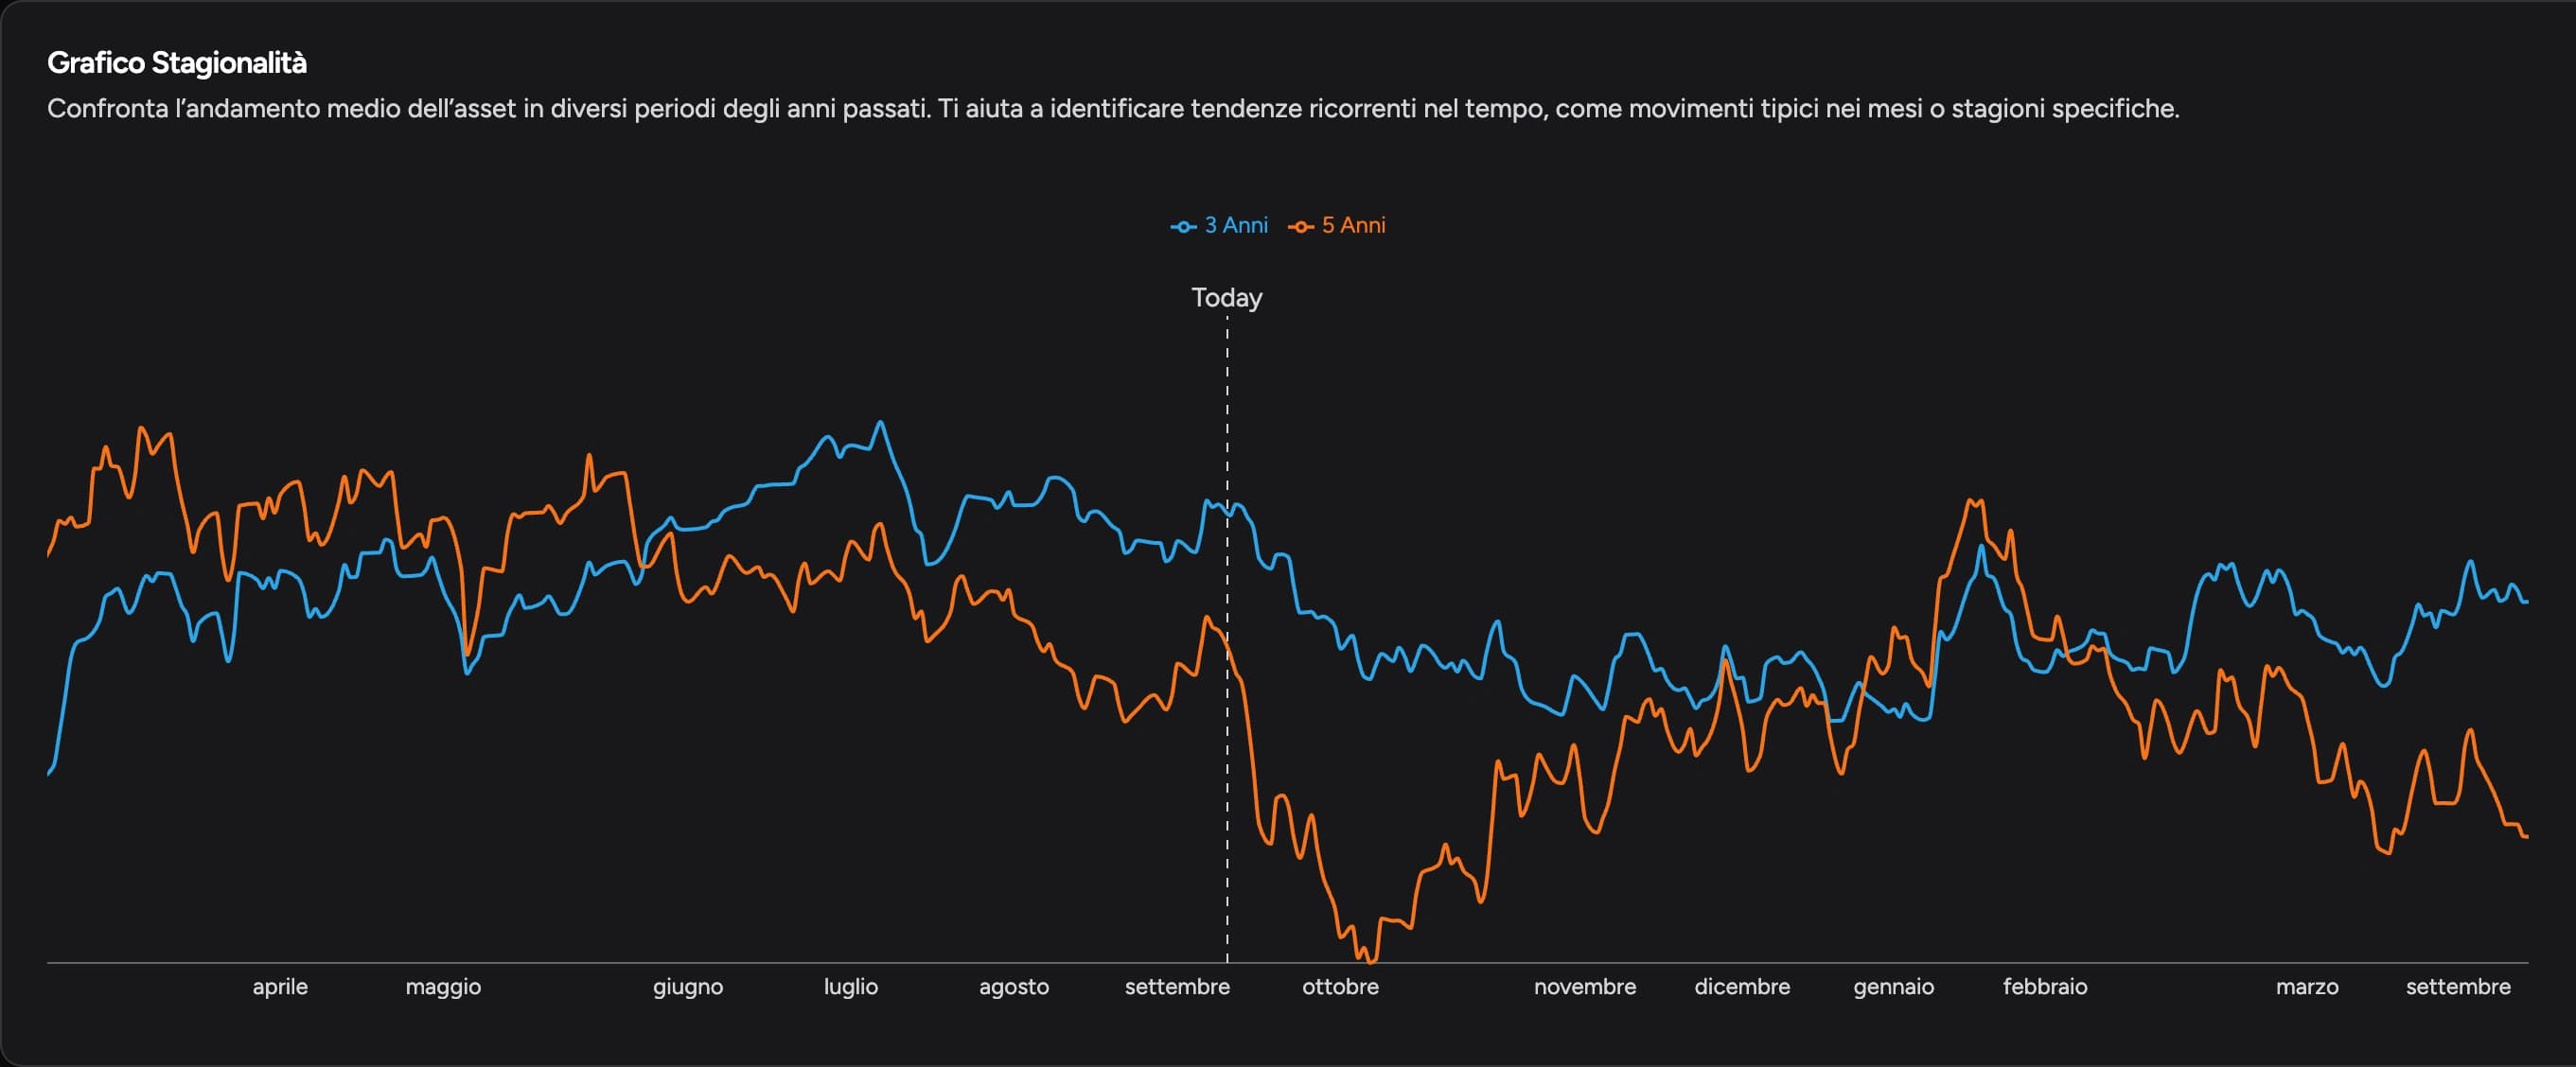
A seasonal chart lines years up on the same calendar and expresses moves in percentage terms, so you can compare, say, March to April across years with very different price levels. Multi-year averages summarize those moves; they aren't the path of any real year.
Three reading rules:
- Slope matters, not height. If the curve is high on the chart but falling between your dates, that stretch is bearish.
- Compare horizons. A recent average (3 years) and a long one (10 years) pointing the same way suggest a more consistent tendency. If they diverge, open the yearly results to see which years make the difference.
- Remember they overlap. The 5-year average contains the 3 years of the shorter one, so they're not two independent tests.
Win frequency and average return can tell opposite stories
Look at these two examples, five years of the same window:
| Case | Yearly results | Positive years | Average return |
|---|---|---|---|
| A | +1%, +1%, +1%, +1%, −8% | 4 of 5 (80%) | −0.8% |
| B | −1%, −1%, −1%, −1%, +8% | 1 of 5 (20%) | +0.8% |
In case A the window is "almost always up" yet loses on average; in case B it's "almost always down" yet gains on average. Frequency counts how often the result was positive; the average also accounts for size.
To judge a window, look at frequency, average and distribution together. The median, the middle value of the sorted results, keeps one exceptional year from carrying the same weight it has in the average.
How much the choice of years matters
A long history adds observations but includes market conditions far from today's; a short one is more current but depends heavily on each year.
Three cautions:
- Exceptional events. Temporarily excluding a period (such as the COVID weeks of 2020) shows how much it drives the curve. It isn't a license to delete a year because it hurts the result.
- Data mining the dates. Try enough entry and exit combinations and you'll find a perfect window in the past. Check it on years other than the ones that revealed it.
- Small samples. Five years are five observations. Treat them as a clue, not proof.
From seasonal window to trade
Say your analysis finds a few historically bullish weeks in a market. In practice:
- Put the market on your watchlist for that period, with a bias toward longs.
- Wait for your setup: a retest of support, a breakout, volume confirmation. You don't have to buy on day one of the window.
- Place the stop where the idea is invalidated, not where the statistic ends.
- Use the end of the window as one exit reference, alongside targets and price structure.
Look at the path within the window too. A period that ends at +2% may have dipped to −6% along the way. A trade with a stop inside that path would have had a very different outcome from simply buying and holding to the end date.
Replay backtesting lets you study exactly this: trade inside the windows you've found and see how seasonal context, entries and management combine.
Analyzing seasonality in DeepView
In DeepView you can compare curves across horizons, select a date range and read its long or short statistics year by year, including maximum favorable and adverse moves. The full walkthrough is in analyzing seasonality with DeepView.
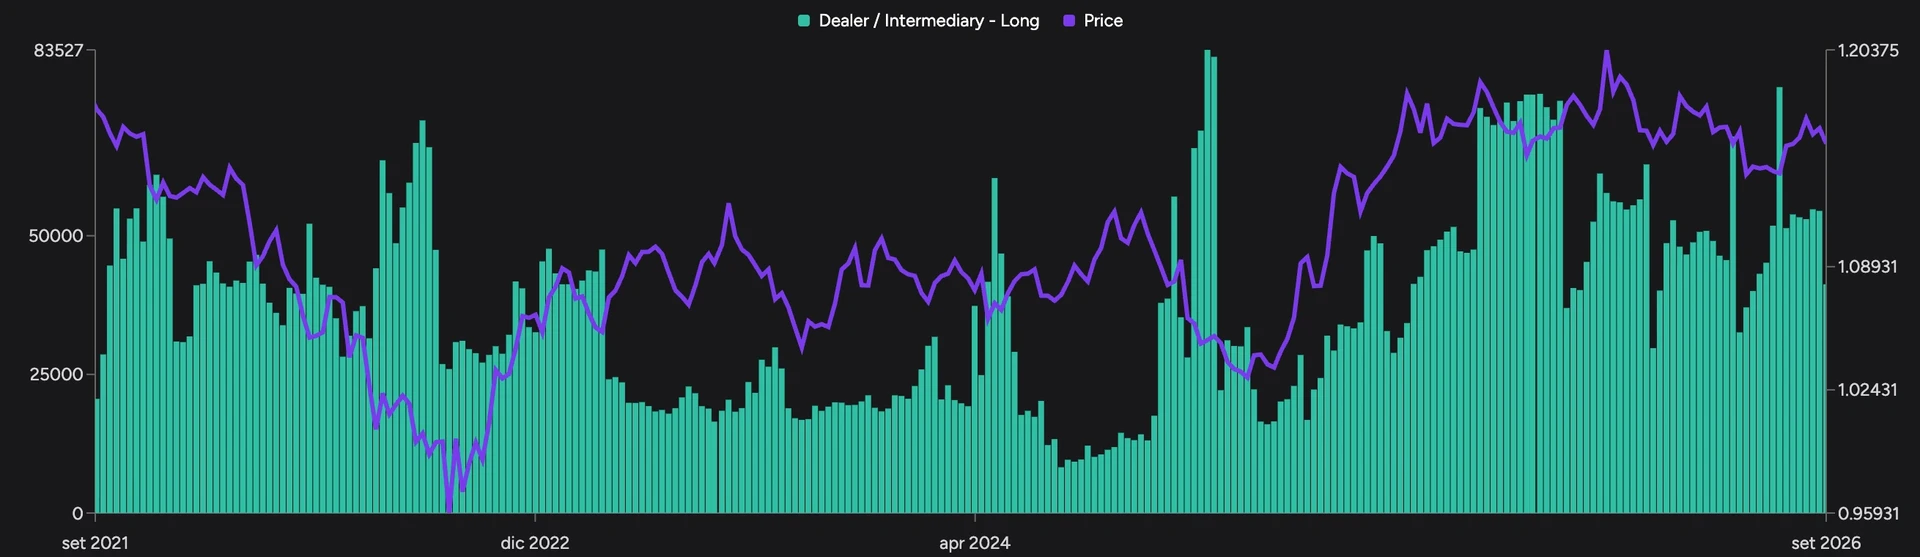
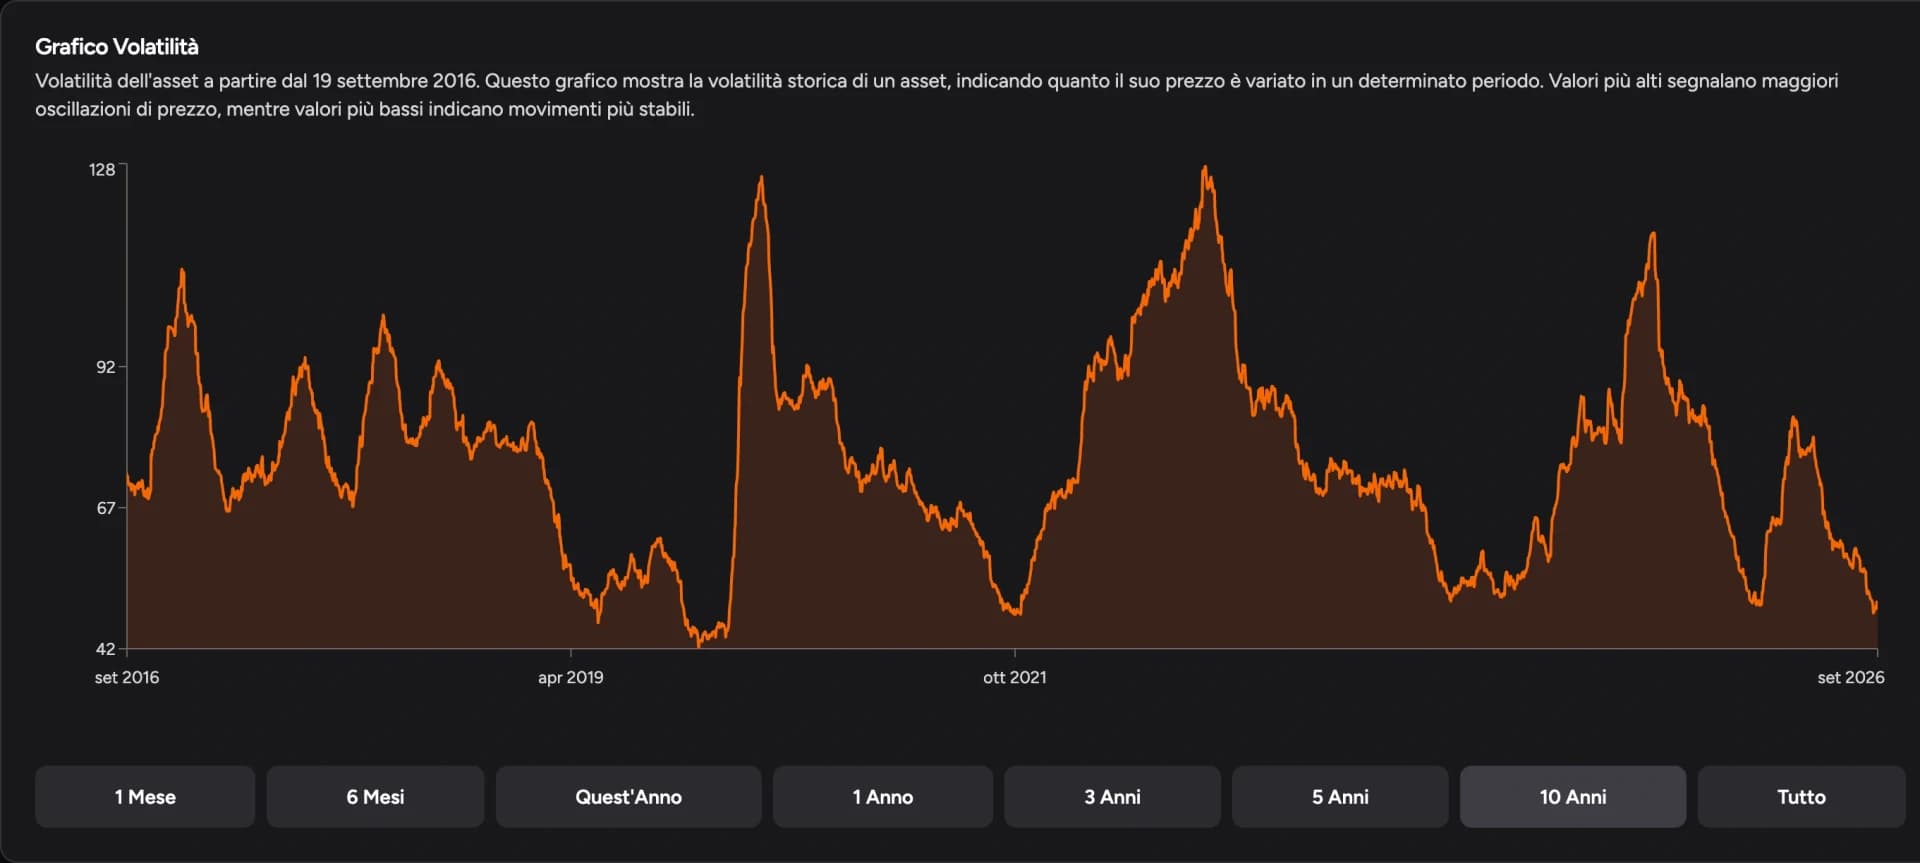
You can pair seasonality with the COT Report and volatility by session without forcing every tool to agree. A mismatch may simply mean the current year is behaving differently from the average.
FAQ
Does seasonality work for forex, indices and commodities?
You can calculate it for any market with enough history. Commodities often have clear seasonal drivers (harvests, energy demand); for currencies and indices, patterns need more careful checking.
How many years of history do I need?
There's no right number. Compare at least one short and one long horizon; if the window holds up on both, it's worth a closer look.
Can I trade on seasonality alone?
It works best as a context filter. Entries, stops and management stay tied to price and your method.
For information and education only, not financial advice. Past results do not guarantee future performance. Leveraged trading carries a high risk of loss.