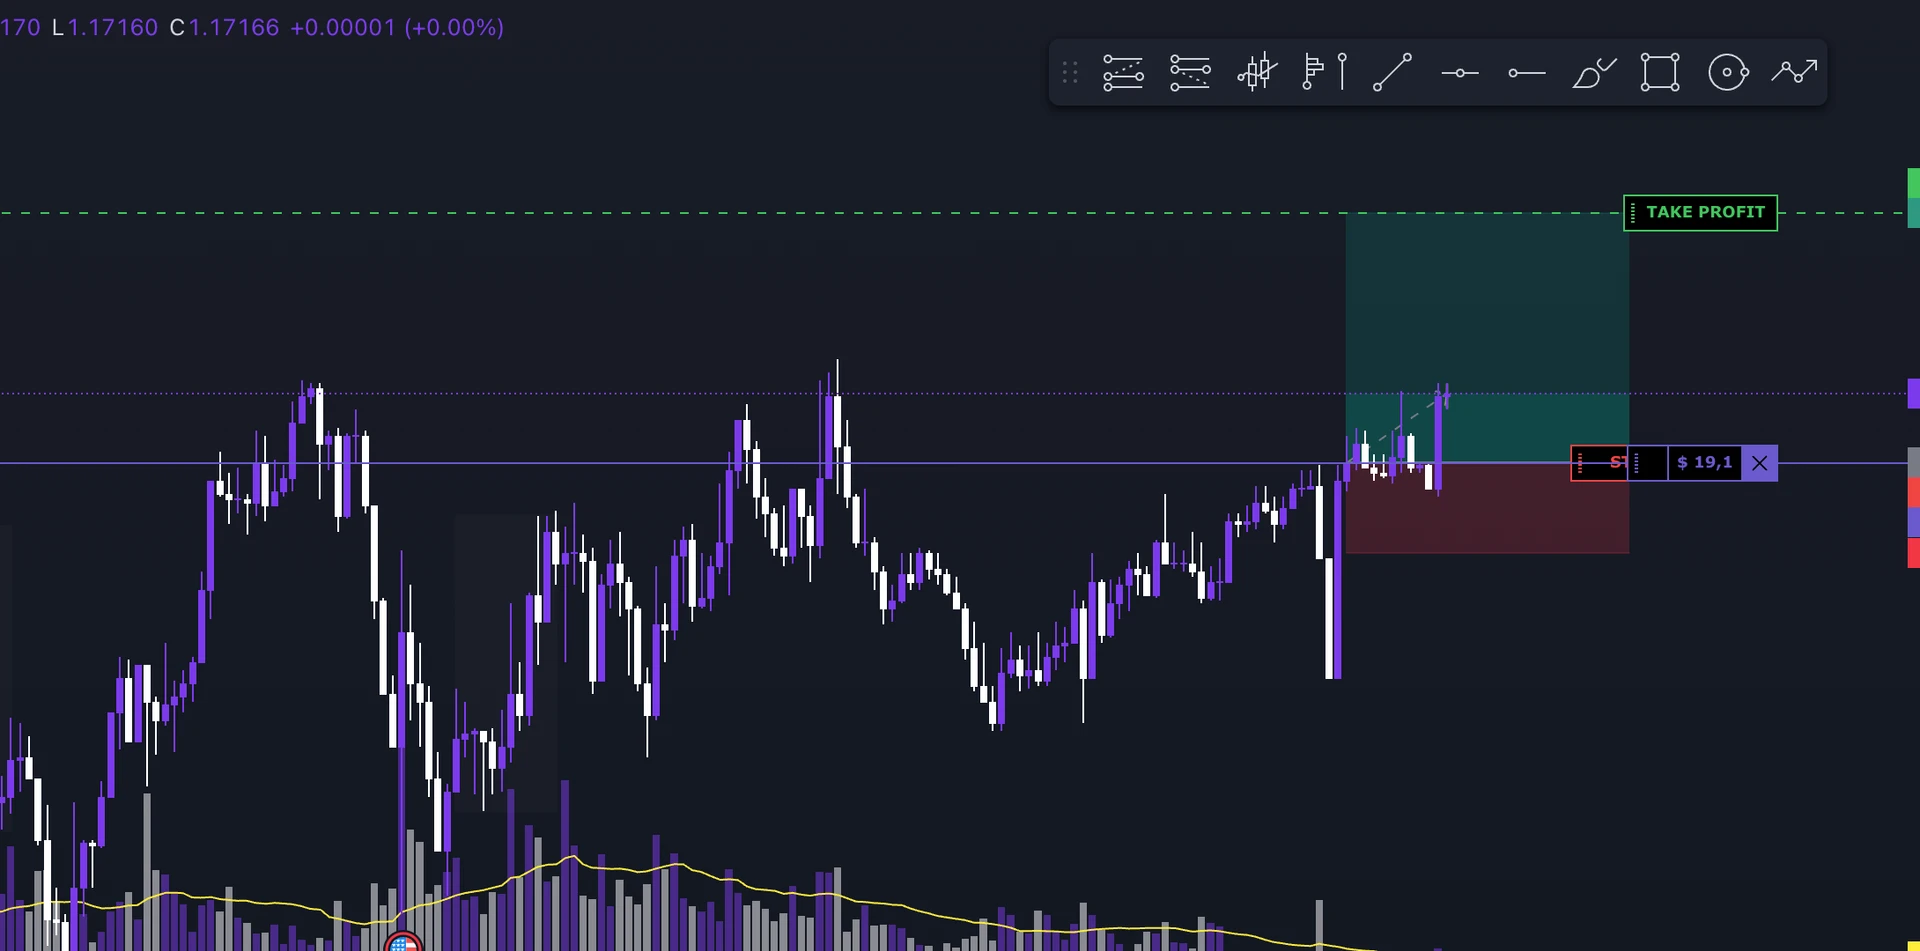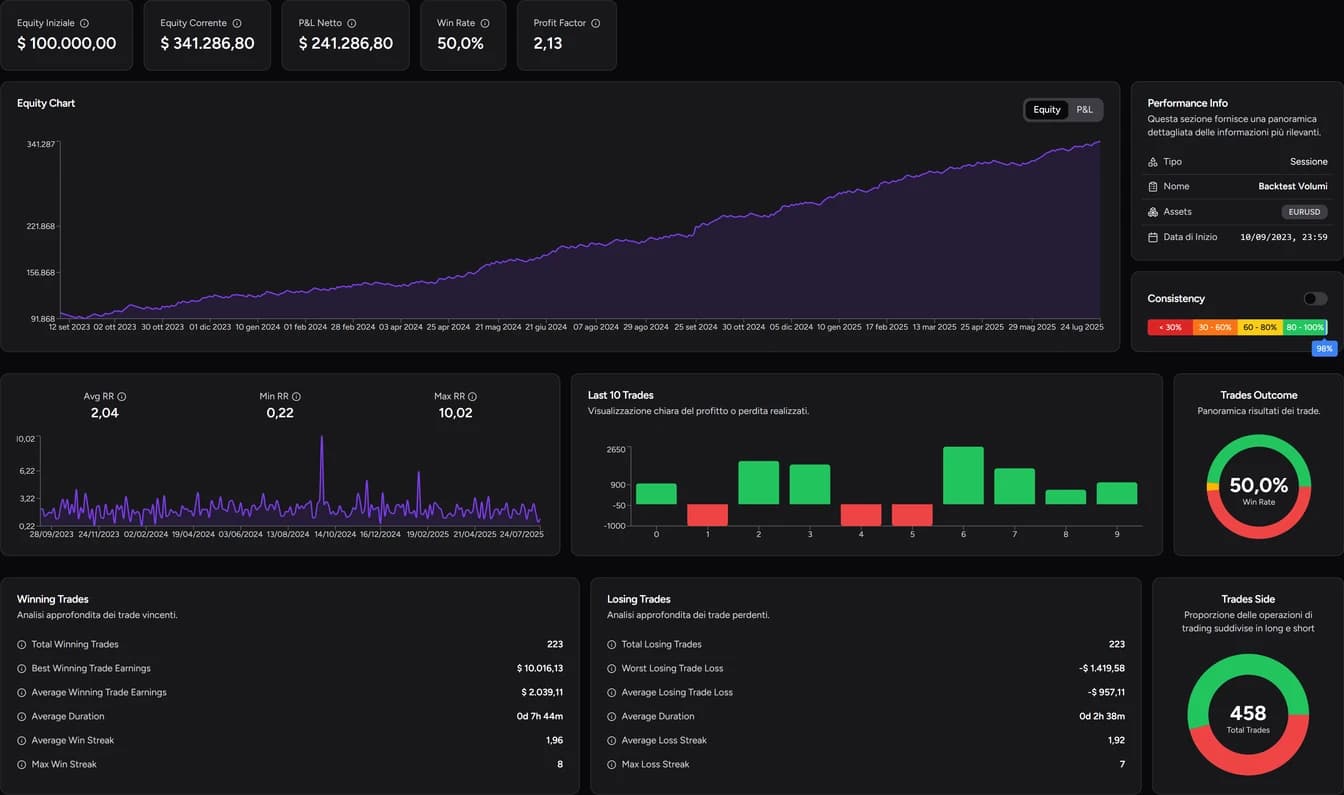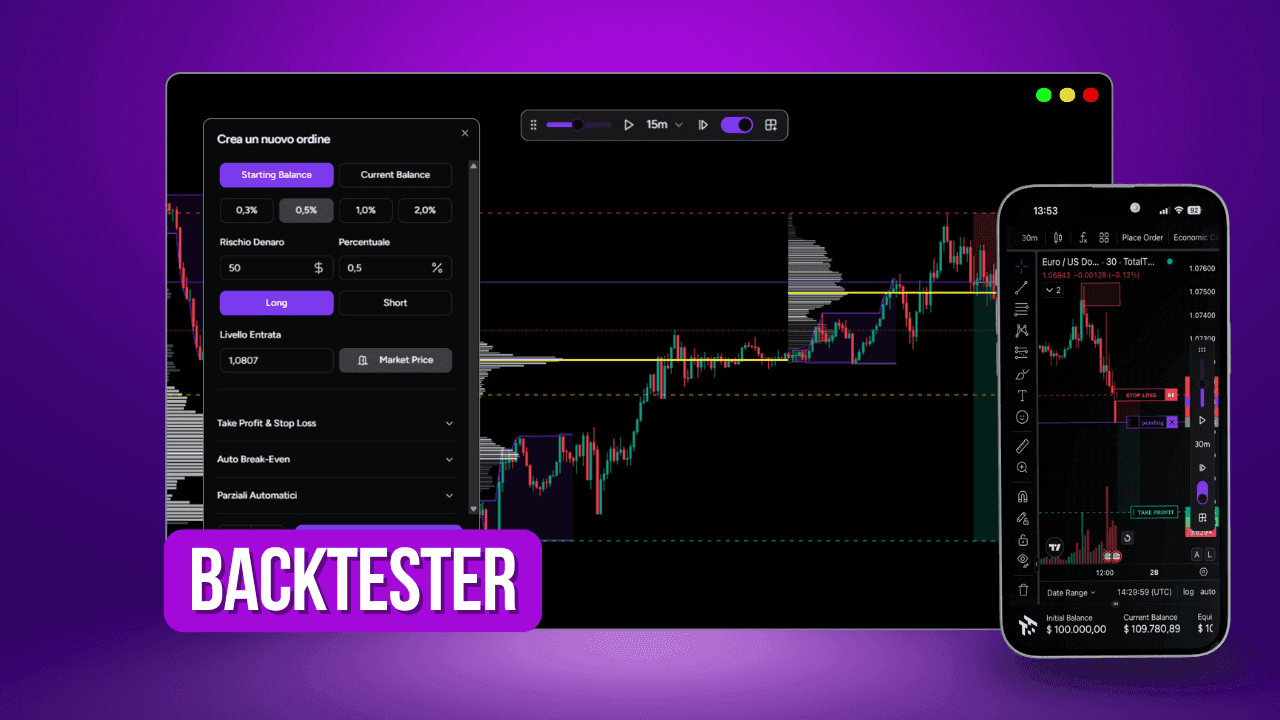
Screenshots show the Italian app interface; controls are explained in the language of this guide.
This guide walks you through creating a strategy, starting a backtest session and taking your first trades on historical data. By the end you'll know how to use Bar Replay, Place Order, the economic calendar, screenshots, Go To, Mini Analytics and indicators. You can start with the session included in Free. This tutorial also covers Pro and Ultra features, identified in the relevant steps; the plan comparison lists all limits.
Before you start
The Backtester has two levels. A strategy holds the rules you want to test. A session is a single test on one asset over one period. You can run several sessions under the same strategy (say, EUR/USD in 2023 and in 2024) and compare them later.
Limits depend on your plan. Free includes one session lasting one month, Basic ten sessions of six months, and Pro and Ultra unlimited sessions. See the plan comparison for details.
1. Create a strategy and a session
- Open Backtest and click Your strategies.
- Name the strategy after the setup, not the asset. "London open breakout" will mean a lot more than "Test 1" once you have ten sessions.
- Create a new session under that strategy and pick the asset and period.
- Press Play to start the simulation.

2. Move through the chart with Bar Replay
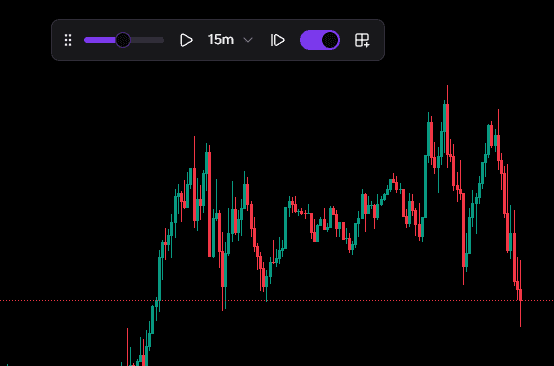
Bar Replay hides future candles and moves the market forward from the point you choose. You can step one candle at a time or let it play automatically at the speed you set.
The Bar Replay switch keeps your analysis timeframe and your replay timeframe in sync. Turn it off to read the chart on H1 while stepping at M5: you watch the hourly candle form without knowing where it closes. Where the data allows, replay goes down to one-second steps.
In practice, speed up when you're not looking for entries and slow down as price approaches your levels. That's where the decisions worth studying happen.
3. Save and apply drawing layouts
Available on Pro and Ultra. Saved drawing layouts let you reuse drawings between sessions.
The drawing layouts icon in Bar Replay lets you save the lines, zones and levels you use in every session as a template, then apply them to a new test in one click. Every session starts with the same chart preparation.

4. Open a trade with Place Order
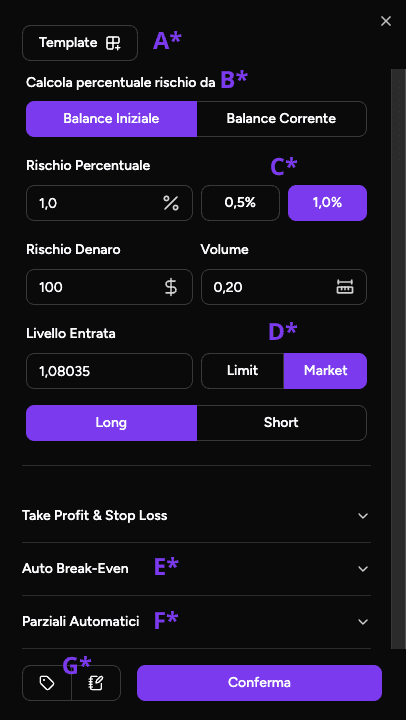
When you spot a setup, draw the position on the chart and click Place Order. The letters match the screenshot below.
- A – Template. Saves risk, automatic partials and auto break-even together. Set the values, open Template, name it and save. Next time, load it instead of retyping.
- B – Reference balance. Choose whether risk is calculated on the initial or the current balance.
- C – Risk. Enter risk as a percentage, a cash amount or a volume. Values update as you type.
- D – Entry. Set the level, choose a market or limit order, and pick long or short.
- E – Auto Break-Even. Moves the stop to entry once price reaches the threshold you set.
- F – Automatic partials. Closes part of the position at predefined levels.
- G – Tags and notes. Write down why you're taking the trade. A month from now, in the trade history, this will be the most useful line you have.
For example, with a $10,000 balance and 1% risk on the initial balance, every trade risks $100, even after a winning streak. On the current balance, once the account reaches $11,000, risk rises to $110. Use the same rule you trade live, or your results won't be comparable.
5. Turn on the economic calendar
Available on Pro and Ultra. The backtest economic calendar requires one of these plans.
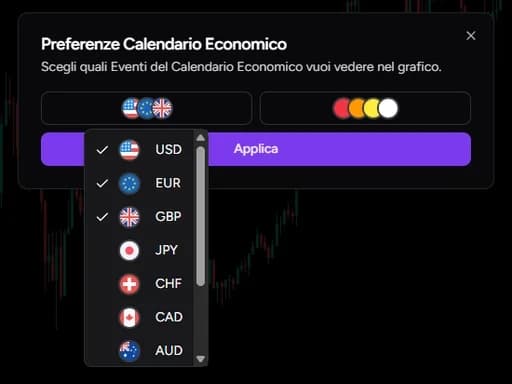
During a test you can display macro events on the chart and filter them by country and impact (none, low, medium, high). It answers two questions: does your setup often form around news releases, and would you avoid or manage them if you were trading live?
6. Document the trade with screenshots and notes
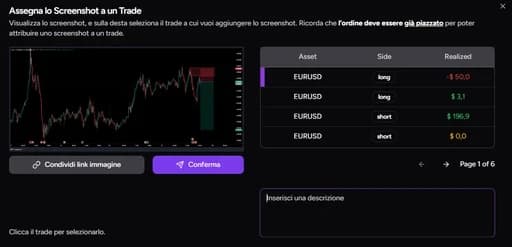
During or after a trade you can save one or more screenshots and edit the note you wrote at entry. A useful note answers three questions: why you entered, what made you change the management, and what you'd do differently.
7. Jump ahead with Go To
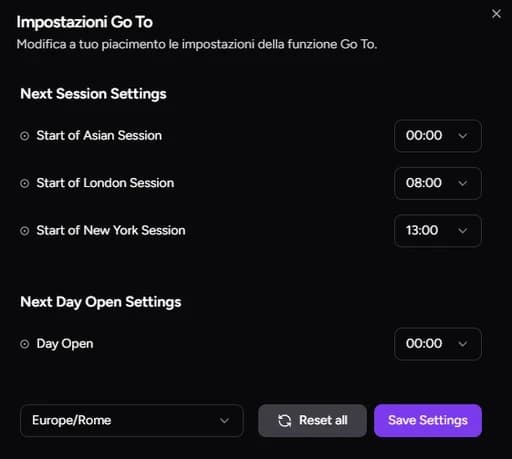
Go To moves the chart to the next day or session. You can customize session opening times, for example London only or New York only, and jump straight to the hours you actually trade.
8. Track results with Mini Analytics
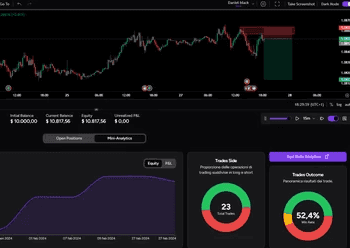
Drag the bottom panel up to open Mini Analytics. You get the equity curve, win rate, trade count and closed-trade history without leaving the chart.
Don't judge a strategy on its win rate after five trades; with a sample that small it swings on every trade. Treat it as a running check and save the verdict for the full Analytics.
9. Add indicators
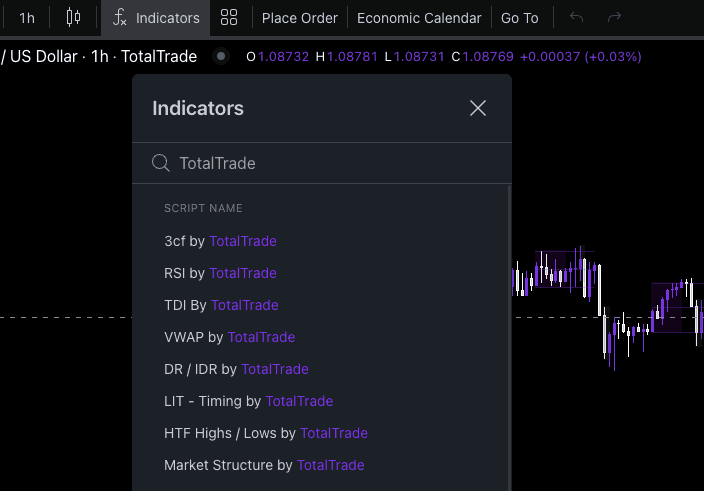
The chart is built on TradingView, so the drawing tools will feel familiar and a selection of standard indicators is available. Search "TotalTrade" in the Indicators panel to find in-house tools such as the Session Indicator, which highlights market sessions. The full list is in the indicator catalog.
After the session: where to go next
- Analytics. Learn to read win rate, profit factor and drawdown together in our guide to analyzing backtest results.
- Trade Review. Reopen each trade with its notes and screenshots, as explained in the trade review guide.
- Backtest Simulator. Recalculate the session with different targets, break-even rules and partials without re-running it. See how to use the Backtest Simulator.
FAQ
Do I need to code to backtest manually?
No. You make decisions on the chart as price moves, just as a discretionary trader would. To see when this approach makes more sense than automated testing, read backtesting without coding.
Can I replay the same period twice?
Yes, but the second time you already know what happens. Use repeat runs to study, and keep them separate from your first pass when you evaluate results.
Does the backtest include spreads and commissions?
Results depend on your settings and on the simulation's execution model. If you trade tight stops, always compare your results against your broker's real costs.
For information and education only, not financial advice. Backtest and simulation results do not guarantee future performance. Leveraged trading carries a high risk of loss.