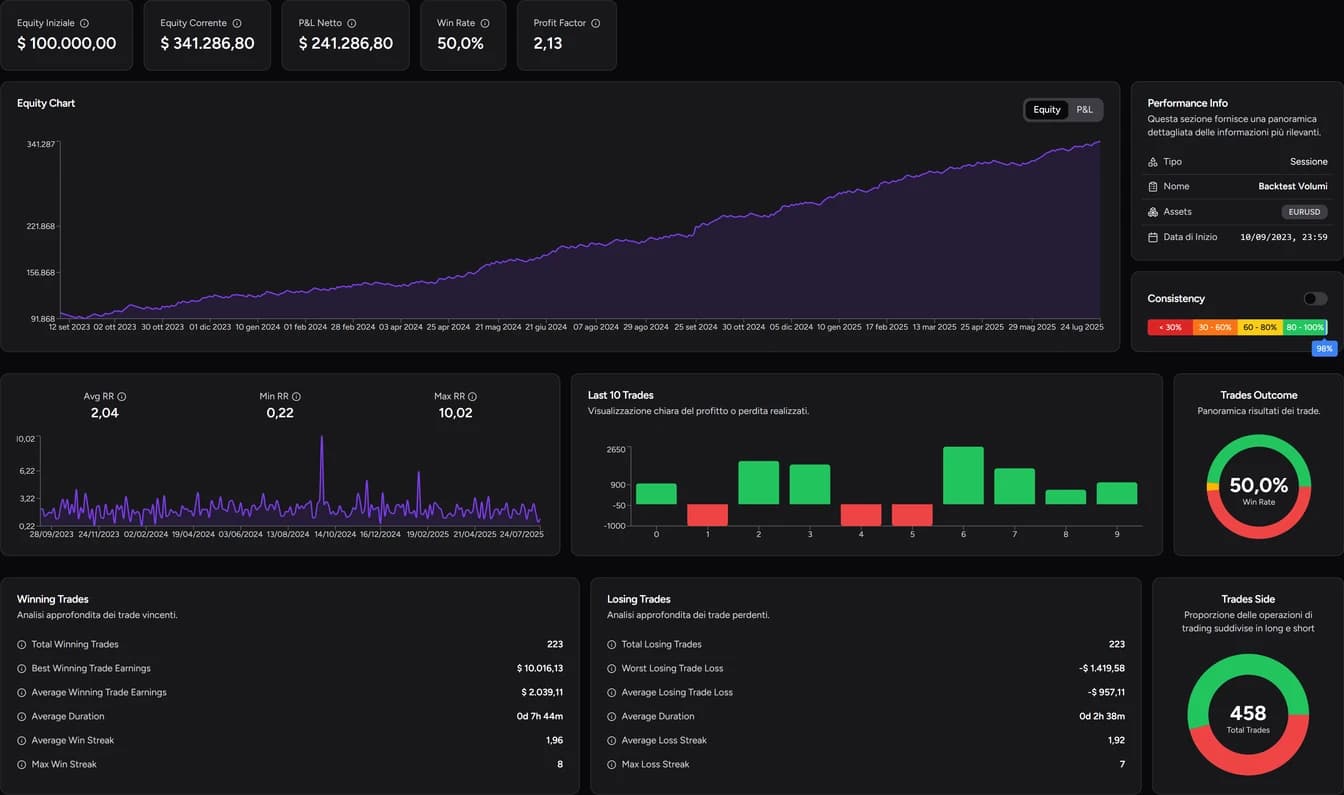
Excel is a solid place to start a trading journal: you probably already have it, it's flexible, and it makes you look at every trade. This guide gives you the columns to use, formulas for the core metrics (win rate, profit factor, drawdown) and the signs that the spreadsheet is starting to cost you more time than it saves.
What Excel does well
- Full control. You decide the columns, categories and calculations.
- No lock-in. The file is yours and works offline.
- Learning. Building the formulas makes you understand what each metric actually measures.
If you take a handful of trades a month on a single account, a well-built sheet is plenty.
The template: the columns you need
Use one row per closed trade. These eleven columns cover both objective data and context:
| Column | Content | Example |
|---|---|---|
| A – Closed | Closing date and time | 12 Mar 2026 15:30 |
| B – Asset | Symbol | EURUSD |
| C – Direction | Long / Short | Long |
| D – Size | Lots or contracts | 0.50 |
| E – Entry | Entry price | 1.0850 |
| F – Exit | Exit price | 1.0890 |
| G – Risk ($) | Loss at the initial stop | 100 |
| H – Net P&L ($) | After commissions and swaps | 196 |
| I – R | P&L divided by risk | 1.96 |
| J – Setup | Strategy name | London breakout |
| K – Notes | Reason and management | Entered on retest, exited at target |
Keep the entry date in a separate column too. To build a curve of realized results, sort trades by closing date and time. Exclude deposits and withdrawals from trade P&L.
Enter your starting balance in cell P1 (for example, 10000).
The core formulas
These formulas use English Excel with commas as separators, and assume trades run from row 2 to row 101.
| Metric | Formula |
|---|---|
| Win rate | =COUNTIF(H2:H101,">0")/COUNT(H2:H101) |
| Profit factor | =SUMIF(H2:H101,">0")/ABS(SUMIF(H2:H101,"<0")) |
| Average result | =AVERAGE(H2:H101) |
| R multiple (in I2) | =H2/G2 |
Check the denominators before using the formulas: without trades, win rate and average result are undefined; without losses, profit factor has no finite value; an R multiple needs positive initial risk. Leave these cases blank or flag them instead of replacing them with zero. Percentage drawdown assumes positive initial capital and a positive previous peak.
Drawdown in three columns:
- L – Balance. In L2 enter
=$P$1+H2, in L3=L2+H3, then fill down. - M – Peak. In M2 enter
=MAX($P$1,L2), in M3=MAX(M2,L3), then fill down. - N – Drawdown %. In N2 enter
=L2/M2-1, then fill down. - Maximum drawdown.
=MIN(N2:N101)
Column L reconstructs the balance after closed trades, not live equity: it excludes unrealized P&L. Drawdown on this curve does not show the adverse excursions while trades were open.
Format column N as a percentage. A value of −10% means the account had fallen 10% from its previous peak. To see how these metrics work together, read our guide to win rate, profit factor and drawdown.
Where the spreadsheet starts to cost you
The problem with Excel isn't computing power. It's the work that stays on your plate.
- Manual entry. Every trade has to be copied from the platform: prices, size, commissions, swaps. To see the real cost, multiply the time one trade takes by your monthly trade count. At 2 minutes per trade and 60 trades a month, that's 2 hours of data entry before any analysis.
- Silent errors. A missed commission, a wrong sign or a row outside the formula range changes your profit factor without anyone noticing.
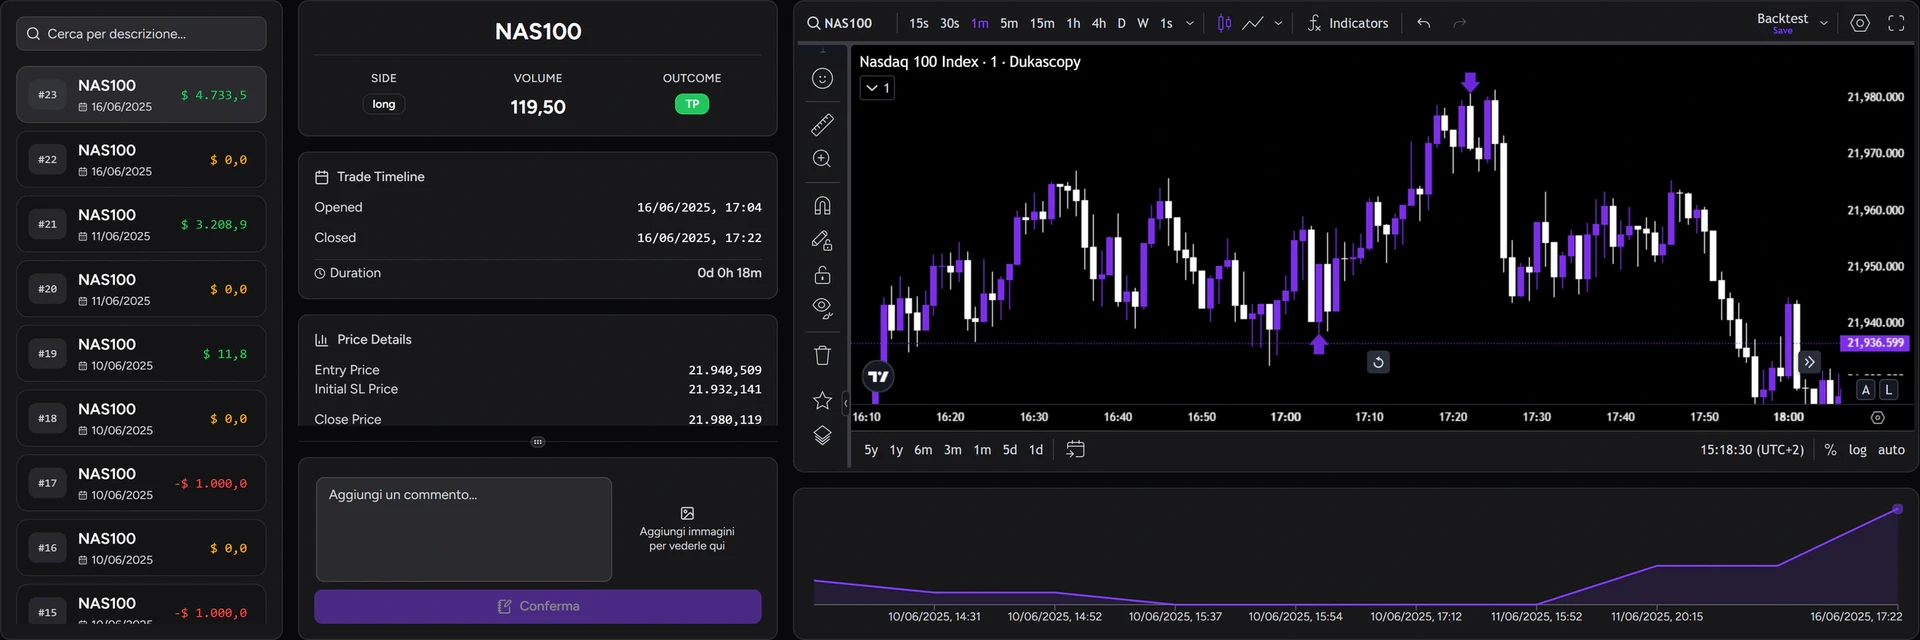
- No chart review. The sheet stores numbers, so reviewing a trade means reopening the platform and finding the date by hand.
- Multiple accounts and platforms. Separate accounts, currencies and time zones multiply the sheets and formulas you have to maintain.
- Analysis by hour or setup. Pivot tables can do it, but every new question means building something new.
Excel vs. a dedicated journal
| Excel | Dedicated journal (TotalTrade) | |
|---|---|---|
| Trade entry | Manual | Automatic sync for MT5 and cTrader, file import for other platforms, or manual |
| Metrics | Built with formulas | Over 30 calculated automatically |
| Analysis by hour, day, tag | Pivot tables | Built-in filters |
| Review on the chart | No | Trade Review on a TradingView chart |
| Screenshots and notes | Links or text cells | Attached to each trade |
| Cost | Depends on the version and license you use | Free plan with limits, paid plans |
When to stay in Excel and when to switch
Stay with Excel if:
- you trade one account with a small number of trades;
- you enjoy building and tweaking your own formulas;
- data entry doesn't bother you.
Consider a dedicated journal if:
- your sheet is weeks behind because updating it is a chore;
- you run several accounts or prop firm challenges;
- you want to review trades on a chart;
- you have questions ("do I lose more on Fridays?") you can't answer without an hour of pivot tables.
You can test this without giving up your sheet. The Free plan of the TotalTrade Journal includes one track record with up to 20 trades. Connect your account using the MT5 guide, or check the broker directory for your broker's method, then compare the numbers with your spreadsheet.
FAQ
Can I import my old Excel journal into TotalTrade?
The documented imports cover files exported from supported platforms (such as MetaTrader, cTrader, NinjaTrader, Tradovate and Interactive Brokers) plus manual entry. For your history, the most reliable route is to re-export the report from the original platform.
What's the most important formula in an Excel trading journal?
Average net result per trade. Win rate and profit factor help you interpret it, but the average result is what tells you whether your trading shows a positive edge on the recorded sample.
Excel or Google Sheets?
The formulas above work almost identically in Google Sheets. If your spreadsheet locale uses commas as decimal separators, swap the argument separators for semicolons.
For information and education only, not financial advice. Backtest and simulation results do not guarantee future performance. Leveraged trading carries a high risk of loss.