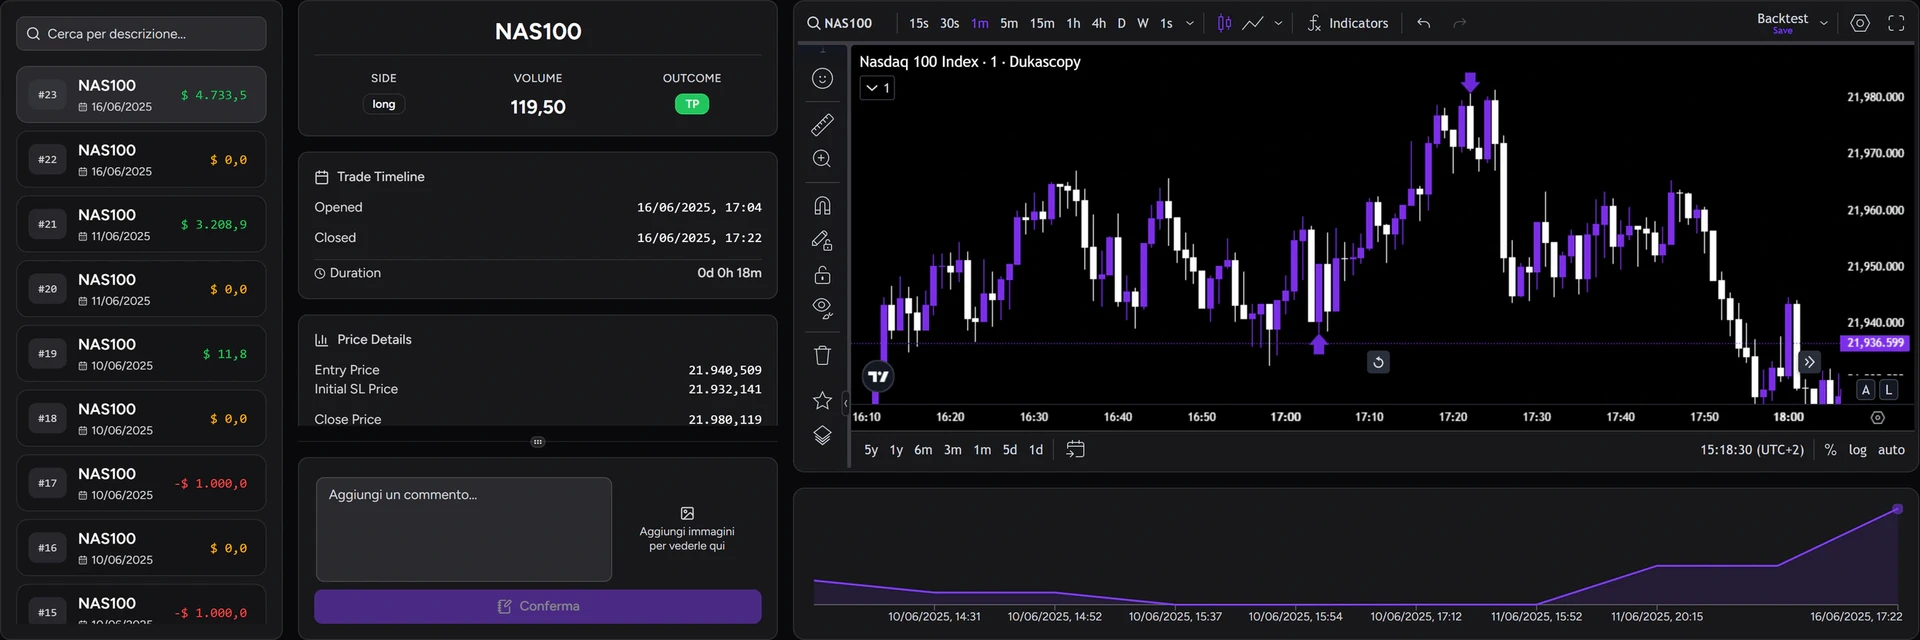
Screenshots show the Italian app interface; controls are explained in the language of this guide.
Full Analytics are included from Basic; Free has limited statistics. See the plan comparison for details.
A losing day could be a normal stop-out, a position that was too large, or a string of entries you shouldn't have taken. The total alone can't tell you which. This guide shows how to use the TotalTrade Journal's statistics, filters and calendar to go from an account summary to individual decisions, in five steps.
Before you start: open the Journal and select the account's track record. If it has no trades yet, connect them with the MetaTrader 5 guide or the cTrader guide, or import a file.
1. Open the track record's statistics
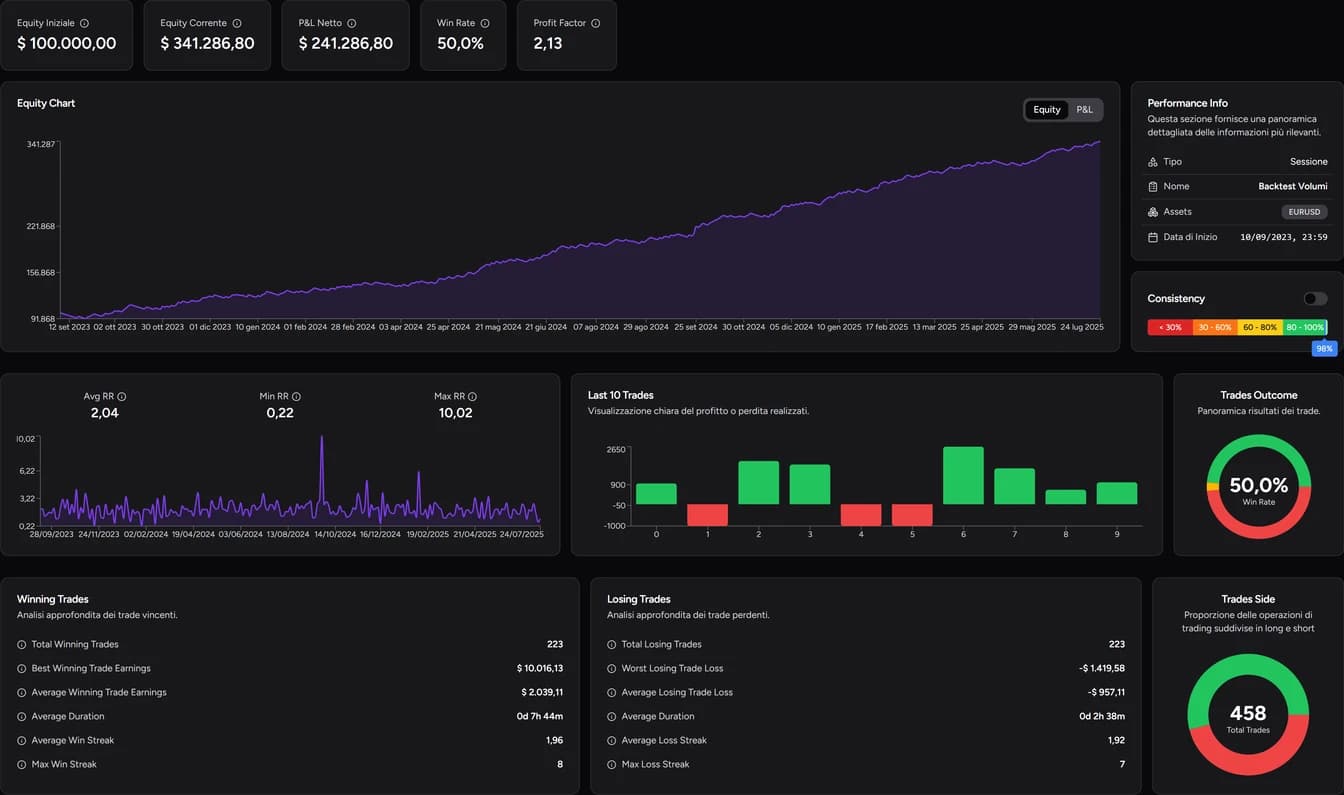
The Statistics tab holds the summary figures and charts. Performance Info shows the track record's name, assets and start date.
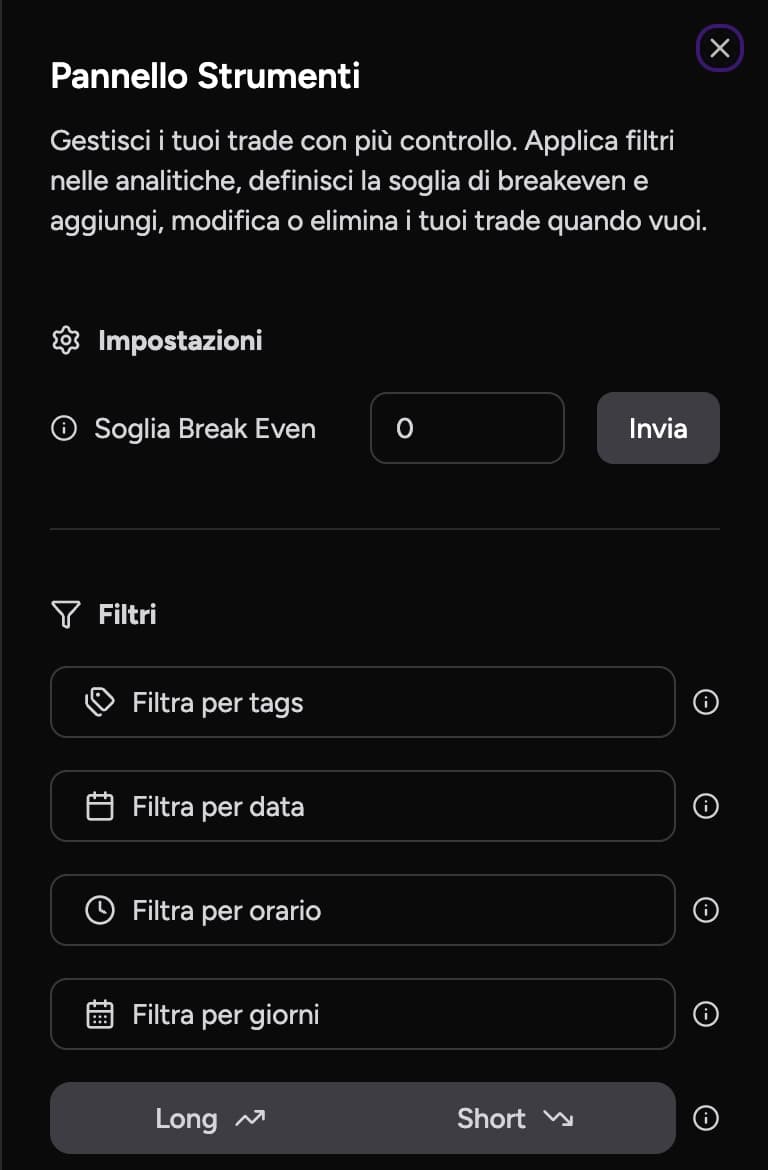
You can analyze the whole period or narrow it with filters. If you want to review one month without mixing it with earlier ones, set the date filter before reading any numbers.
2. Read profit, Win Rate and Profit Factor together
Initial Equity, Current Equity and Net P&L summarize the account. The Equity chart shows how capital has moved; the P&L selector switches to a view of profits and losses.
Win Rate is the share of winning trades; Profit Factor compares what you made with what you lost. Read separately, they can mislead:
| Example | Value |
|---|---|
| 6 trades at +$50 | +$300 |
| 4 trades at −$100 | −$400 |
| Win Rate | 60% |
| Total result | −$100 |
| Profit Factor | 300 ÷ 400 = 0.75 |
A Profit Factor below 1 means losses exceed profits, even though you win more often than you lose. For the full meaning of each metric, see win rate, profit factor and drawdown.
3. Compare winners, losers and duration
The Winning Trades and Losing Trades panels separate positive and negative trades: counts, average results, best and worst trade, duration and consecutive streaks.
Three questions to ask:
- Is your average loss growing? Open those trades in History and check whether size, stop distance or exit timing changed. Results can worsen even with a stable Win Rate.
- Do losing trades last much longer than winners? That may be normal for your method, or a sign you're delaying exits.
- Do longs and shorts behave the same? Trades Side shows the split; the Long and Short filters let you read statistics for one direction only.
If you tag trades by setup, filter by tag and compare results across strategies.
4. Analyze results by hour and weekday
P&L per Hour groups results by hour; P&L per Day groups them by weekday. The Open / Close selector decides which moment of the trade is used:
- Open to evaluate the times you enter;
- Close to see when you realize gains and losses.
A trade opened Monday evening and closed Tuesday morning falls on different days in the two views. In the guide's screenshot the time zone is Europe/Rome; use the same reference when comparing these charts with your trading platform or with DeepView's hourly volatility.
Always check the trade count too. A time window with far more trades can show a higher total P&L without a better average result.
In the monthly summary, Current Balance and Initial Balance only change the base of the percentage calculation, not the amount won or lost.
5. Use the calendar to review a session
The calendar shows daily results plus weekly and monthly totals. Today jumps to the current date; Last Trade jumps to the most recent recorded trade. The Open / Close setting also decides which day each trade belongs to here.
From a day you want to understand, go to History and open the trades. You might find a single large stop-out, or lots of small entries after the first loss. In the second case, the question is why you kept trading.
Review your winning days as well. A gain made by taking more risk than planned deserves as much attention as a loss. To review a single trade with notes and screenshots, follow the trade review guide.
A 15-minute weekly routine
- Filter the week and read Net P&L, Win Rate and Profit Factor.
- Check the average loss and the duration of losing trades.
- Look at P&L per Hour using Open.
- Open your worst and best days from the calendar.
- Write one rule for next week and check it at your next review.
FAQ
Why does the same trade appear on different days when I switch between Open and Close?
Open uses the entry date and Close the exit date. If you hold a position overnight, its result is assigned to different days depending on the setting.
How do I compare results for a single setup?
If you've tagged that setup's trades, select the tag in the filters. You can narrow further by date, time or direction, then open the trades in History.
How many trades do I need before trusting an hourly statistic?
The more the better. With only a few trades in a time window, one outlier can move the average, so always check the count next to the P&L.
For information and education only, not financial advice. Leveraged trading carries a high risk of loss.